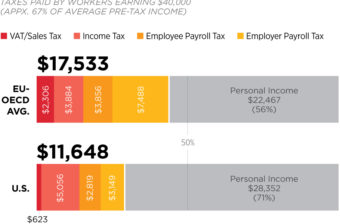
EU Taxes Hammer Middle Class
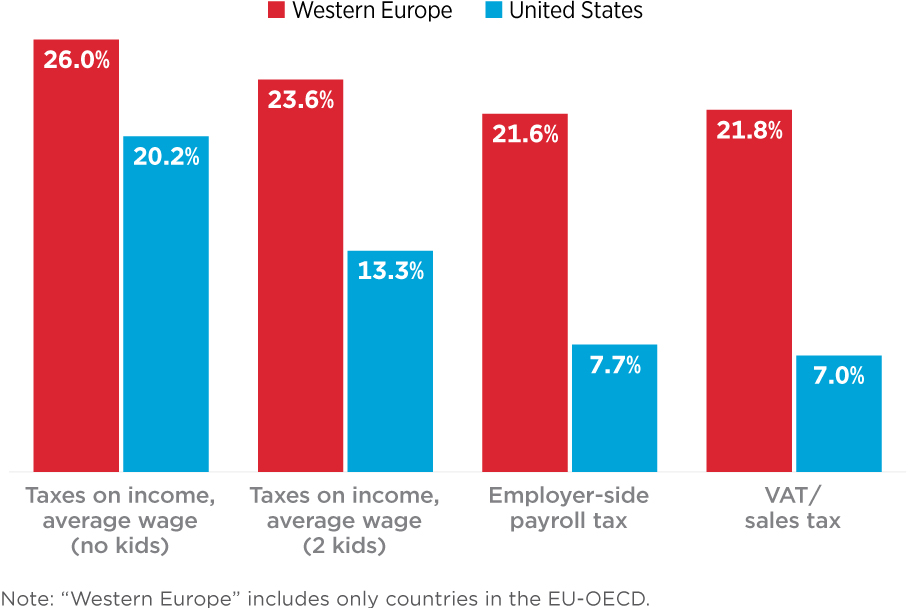
Many left-wing activists push for America to embrace a more expansive welfare system along the lines of what many governments in Western Europe have. However, the resulting level of spending forces governments to impose heavy taxation across the board. Middle class families in America face much lower taxes than comparable families in Europe.
Created May 31, 2023
Source: OECD, Tax Foundation
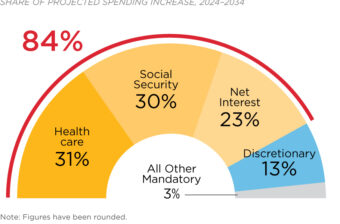
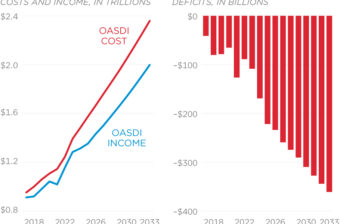
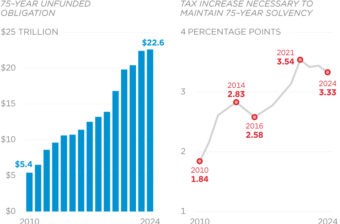
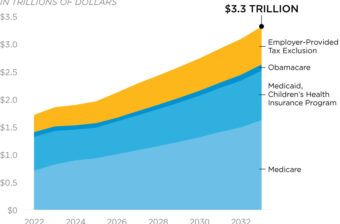
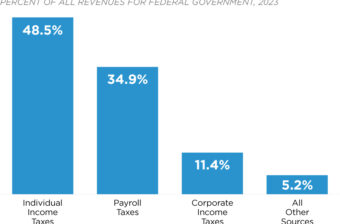

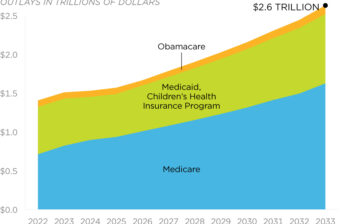
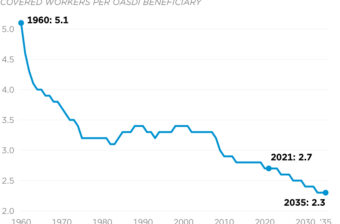
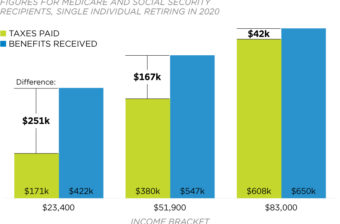


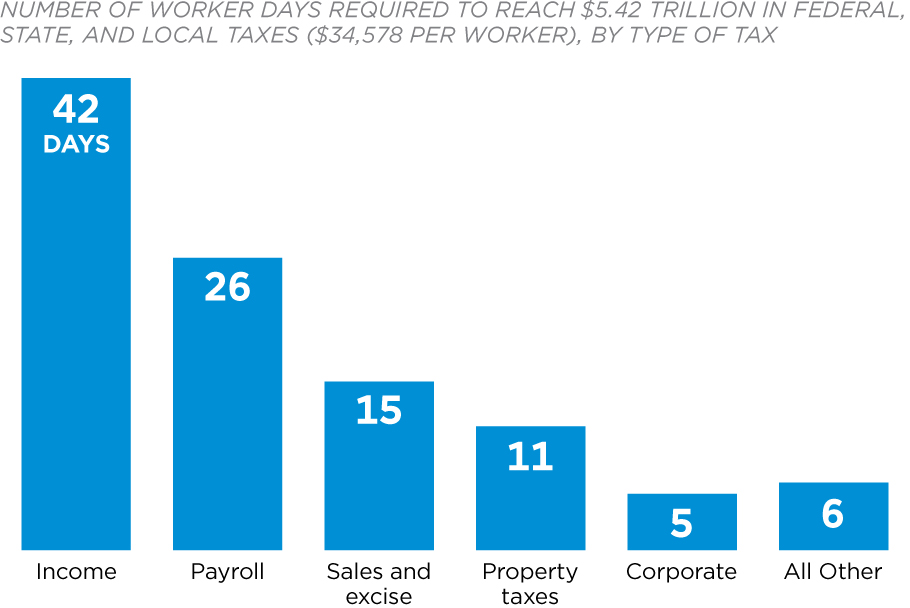
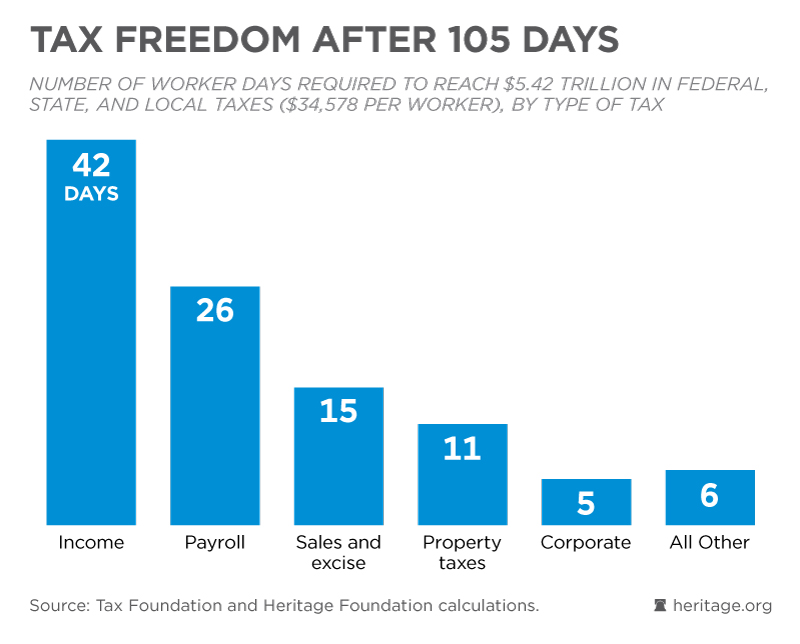
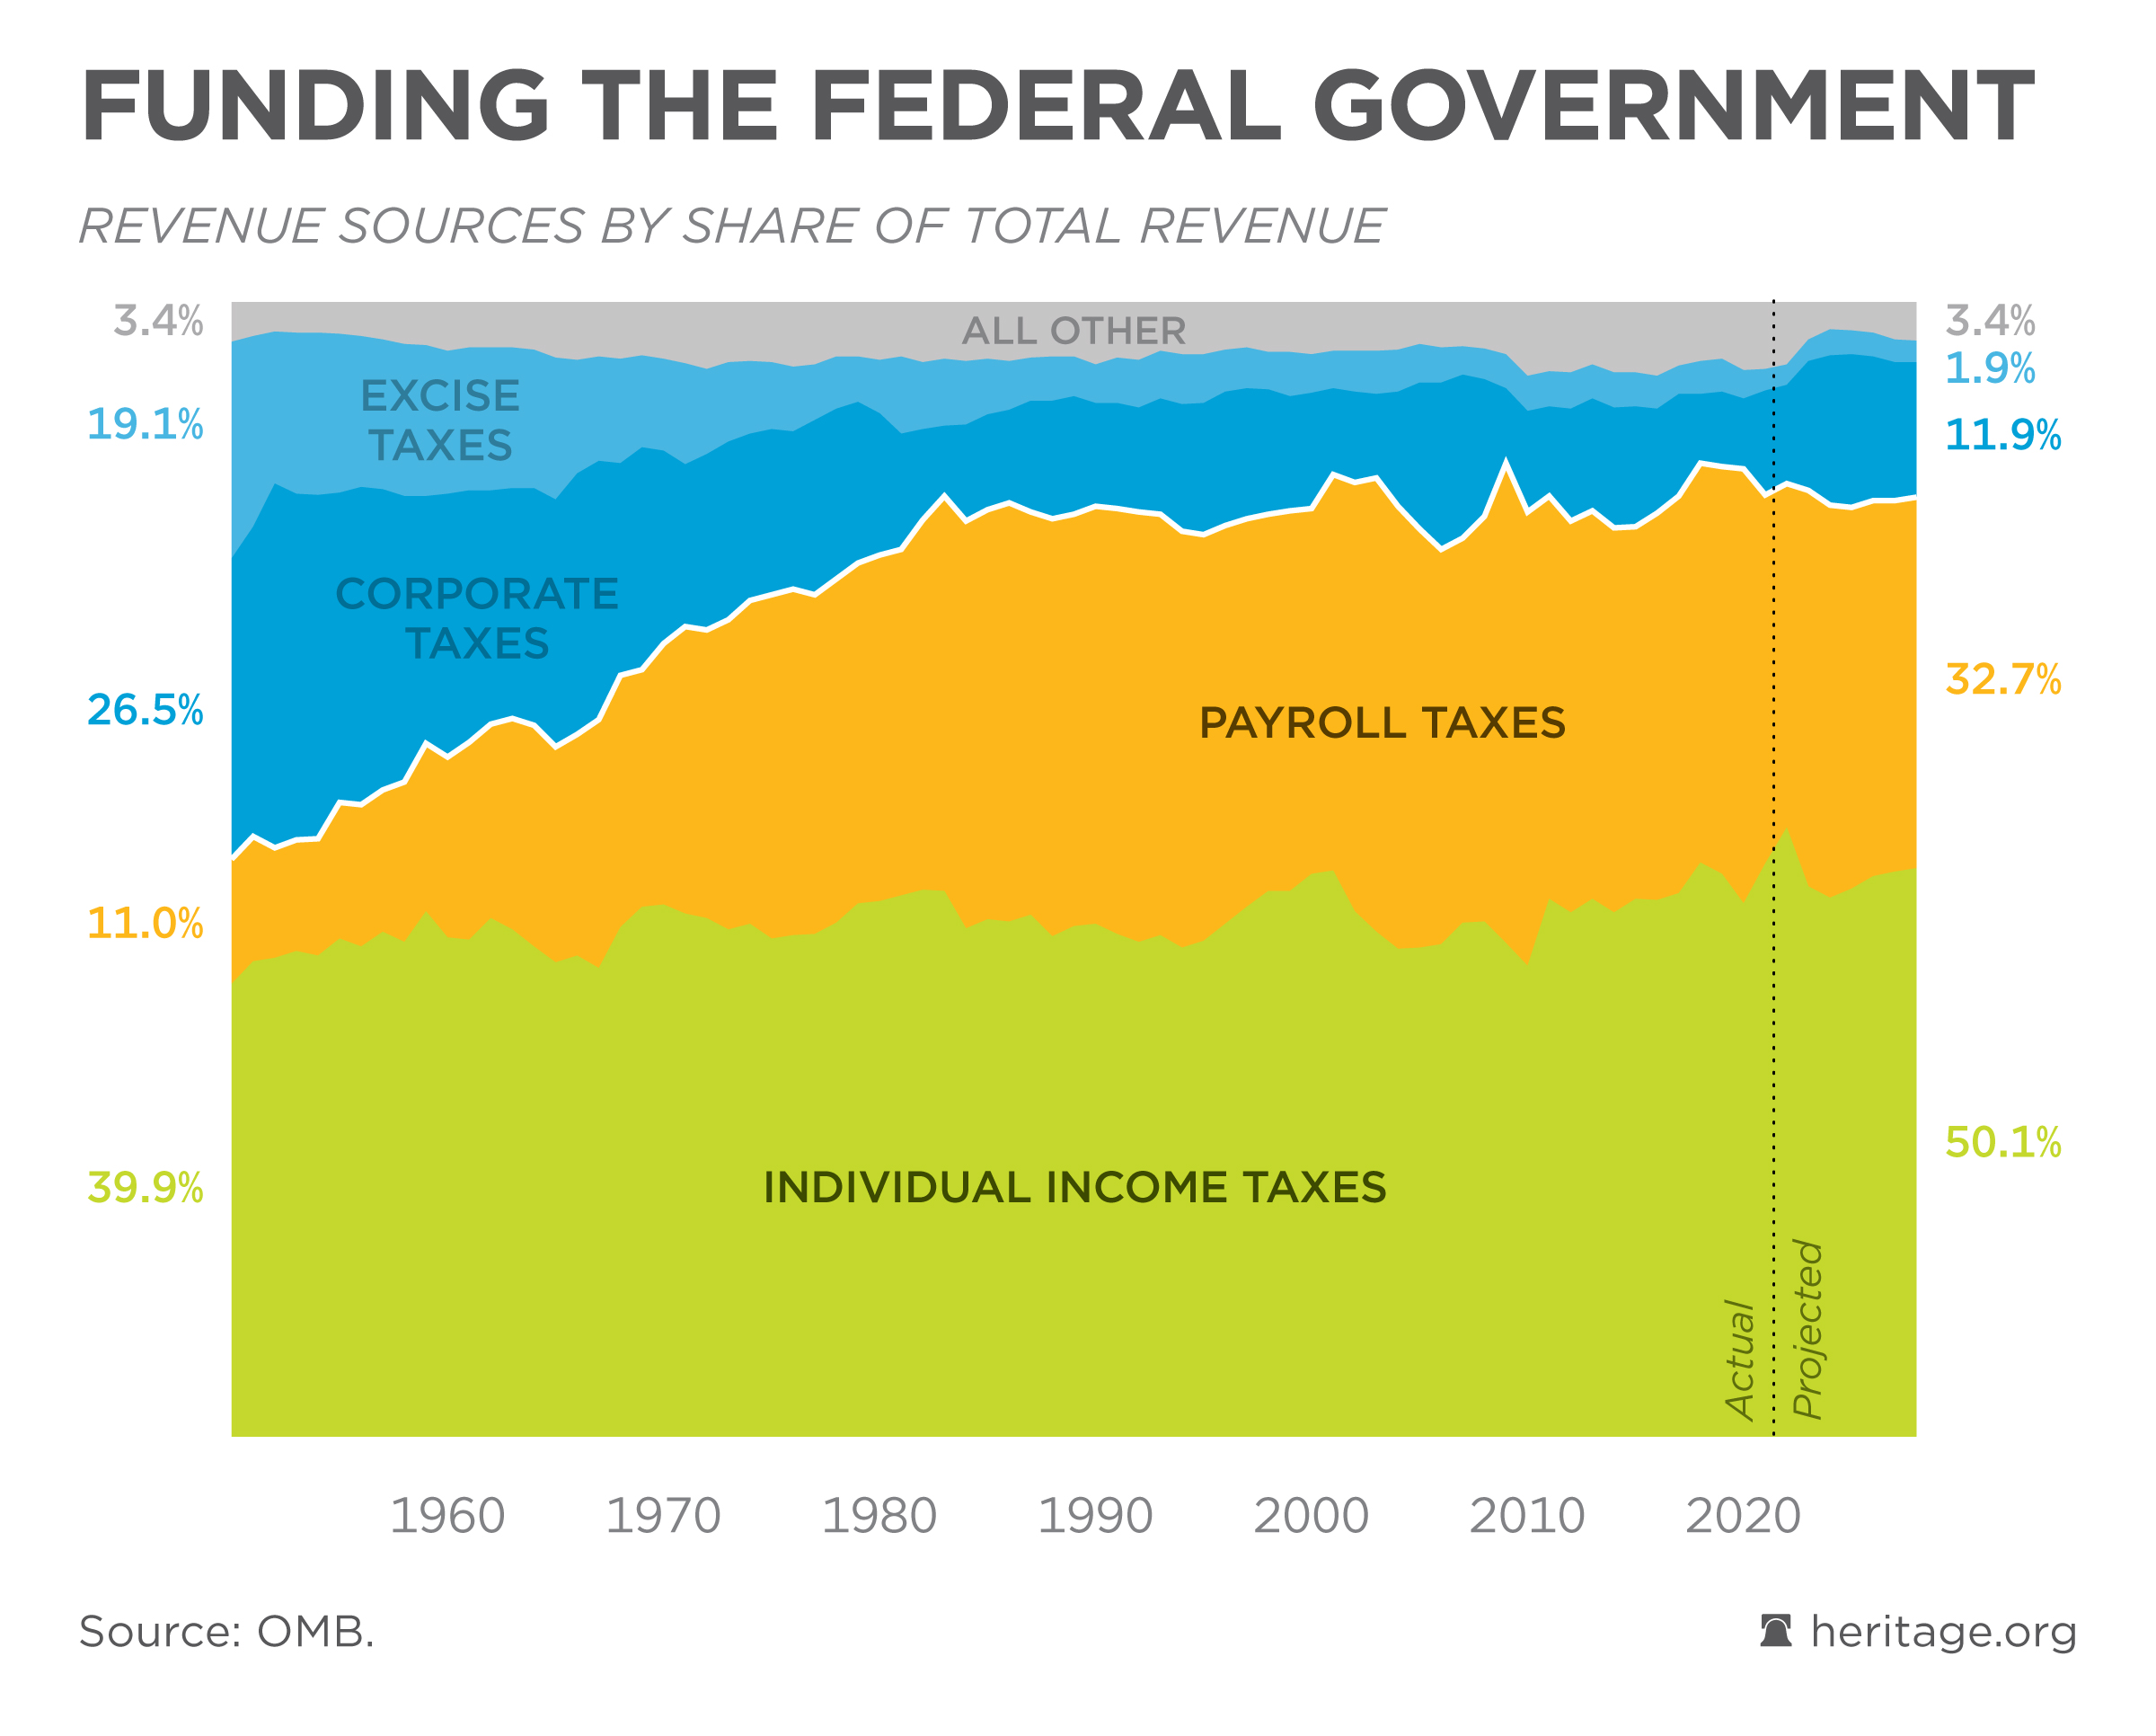
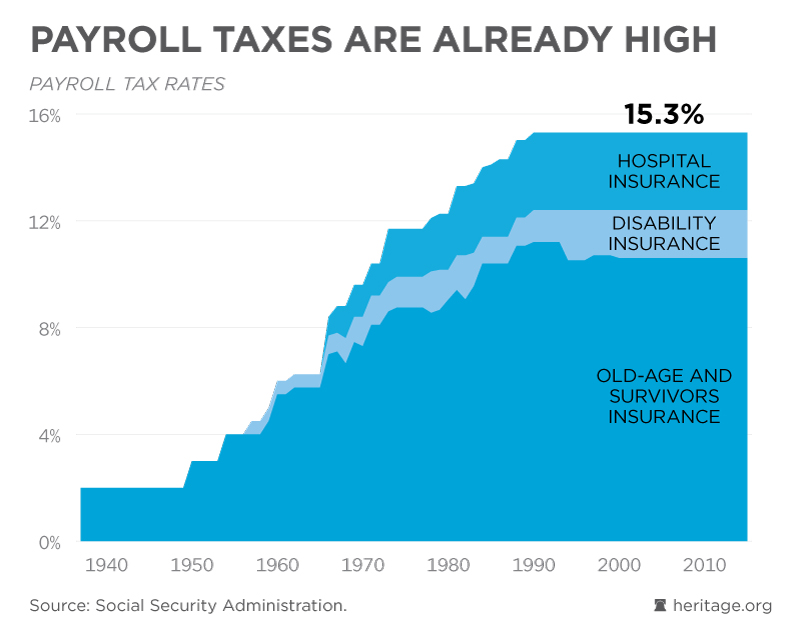
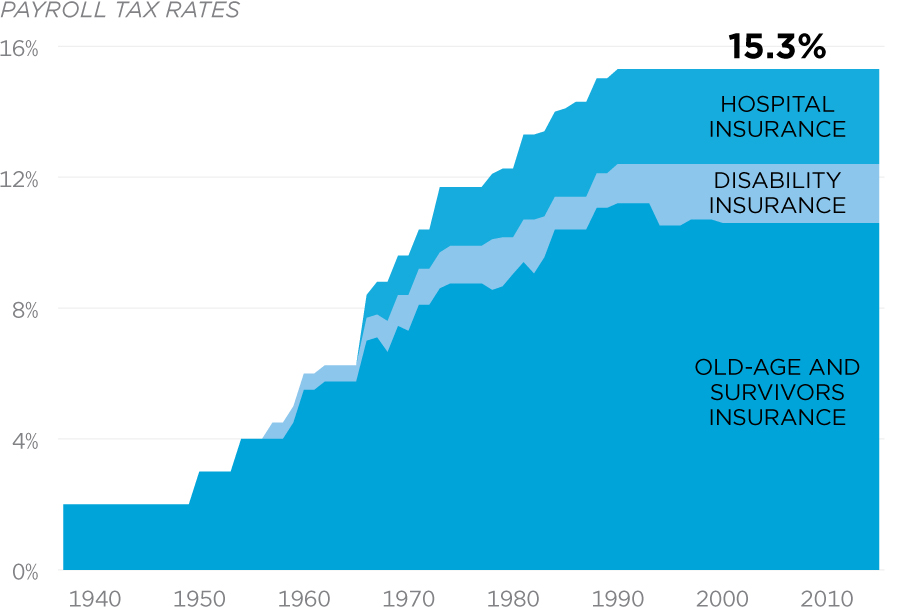 Without reforms, spending on Medicare and Social Security is threatening even higher payroll taxes for workers.
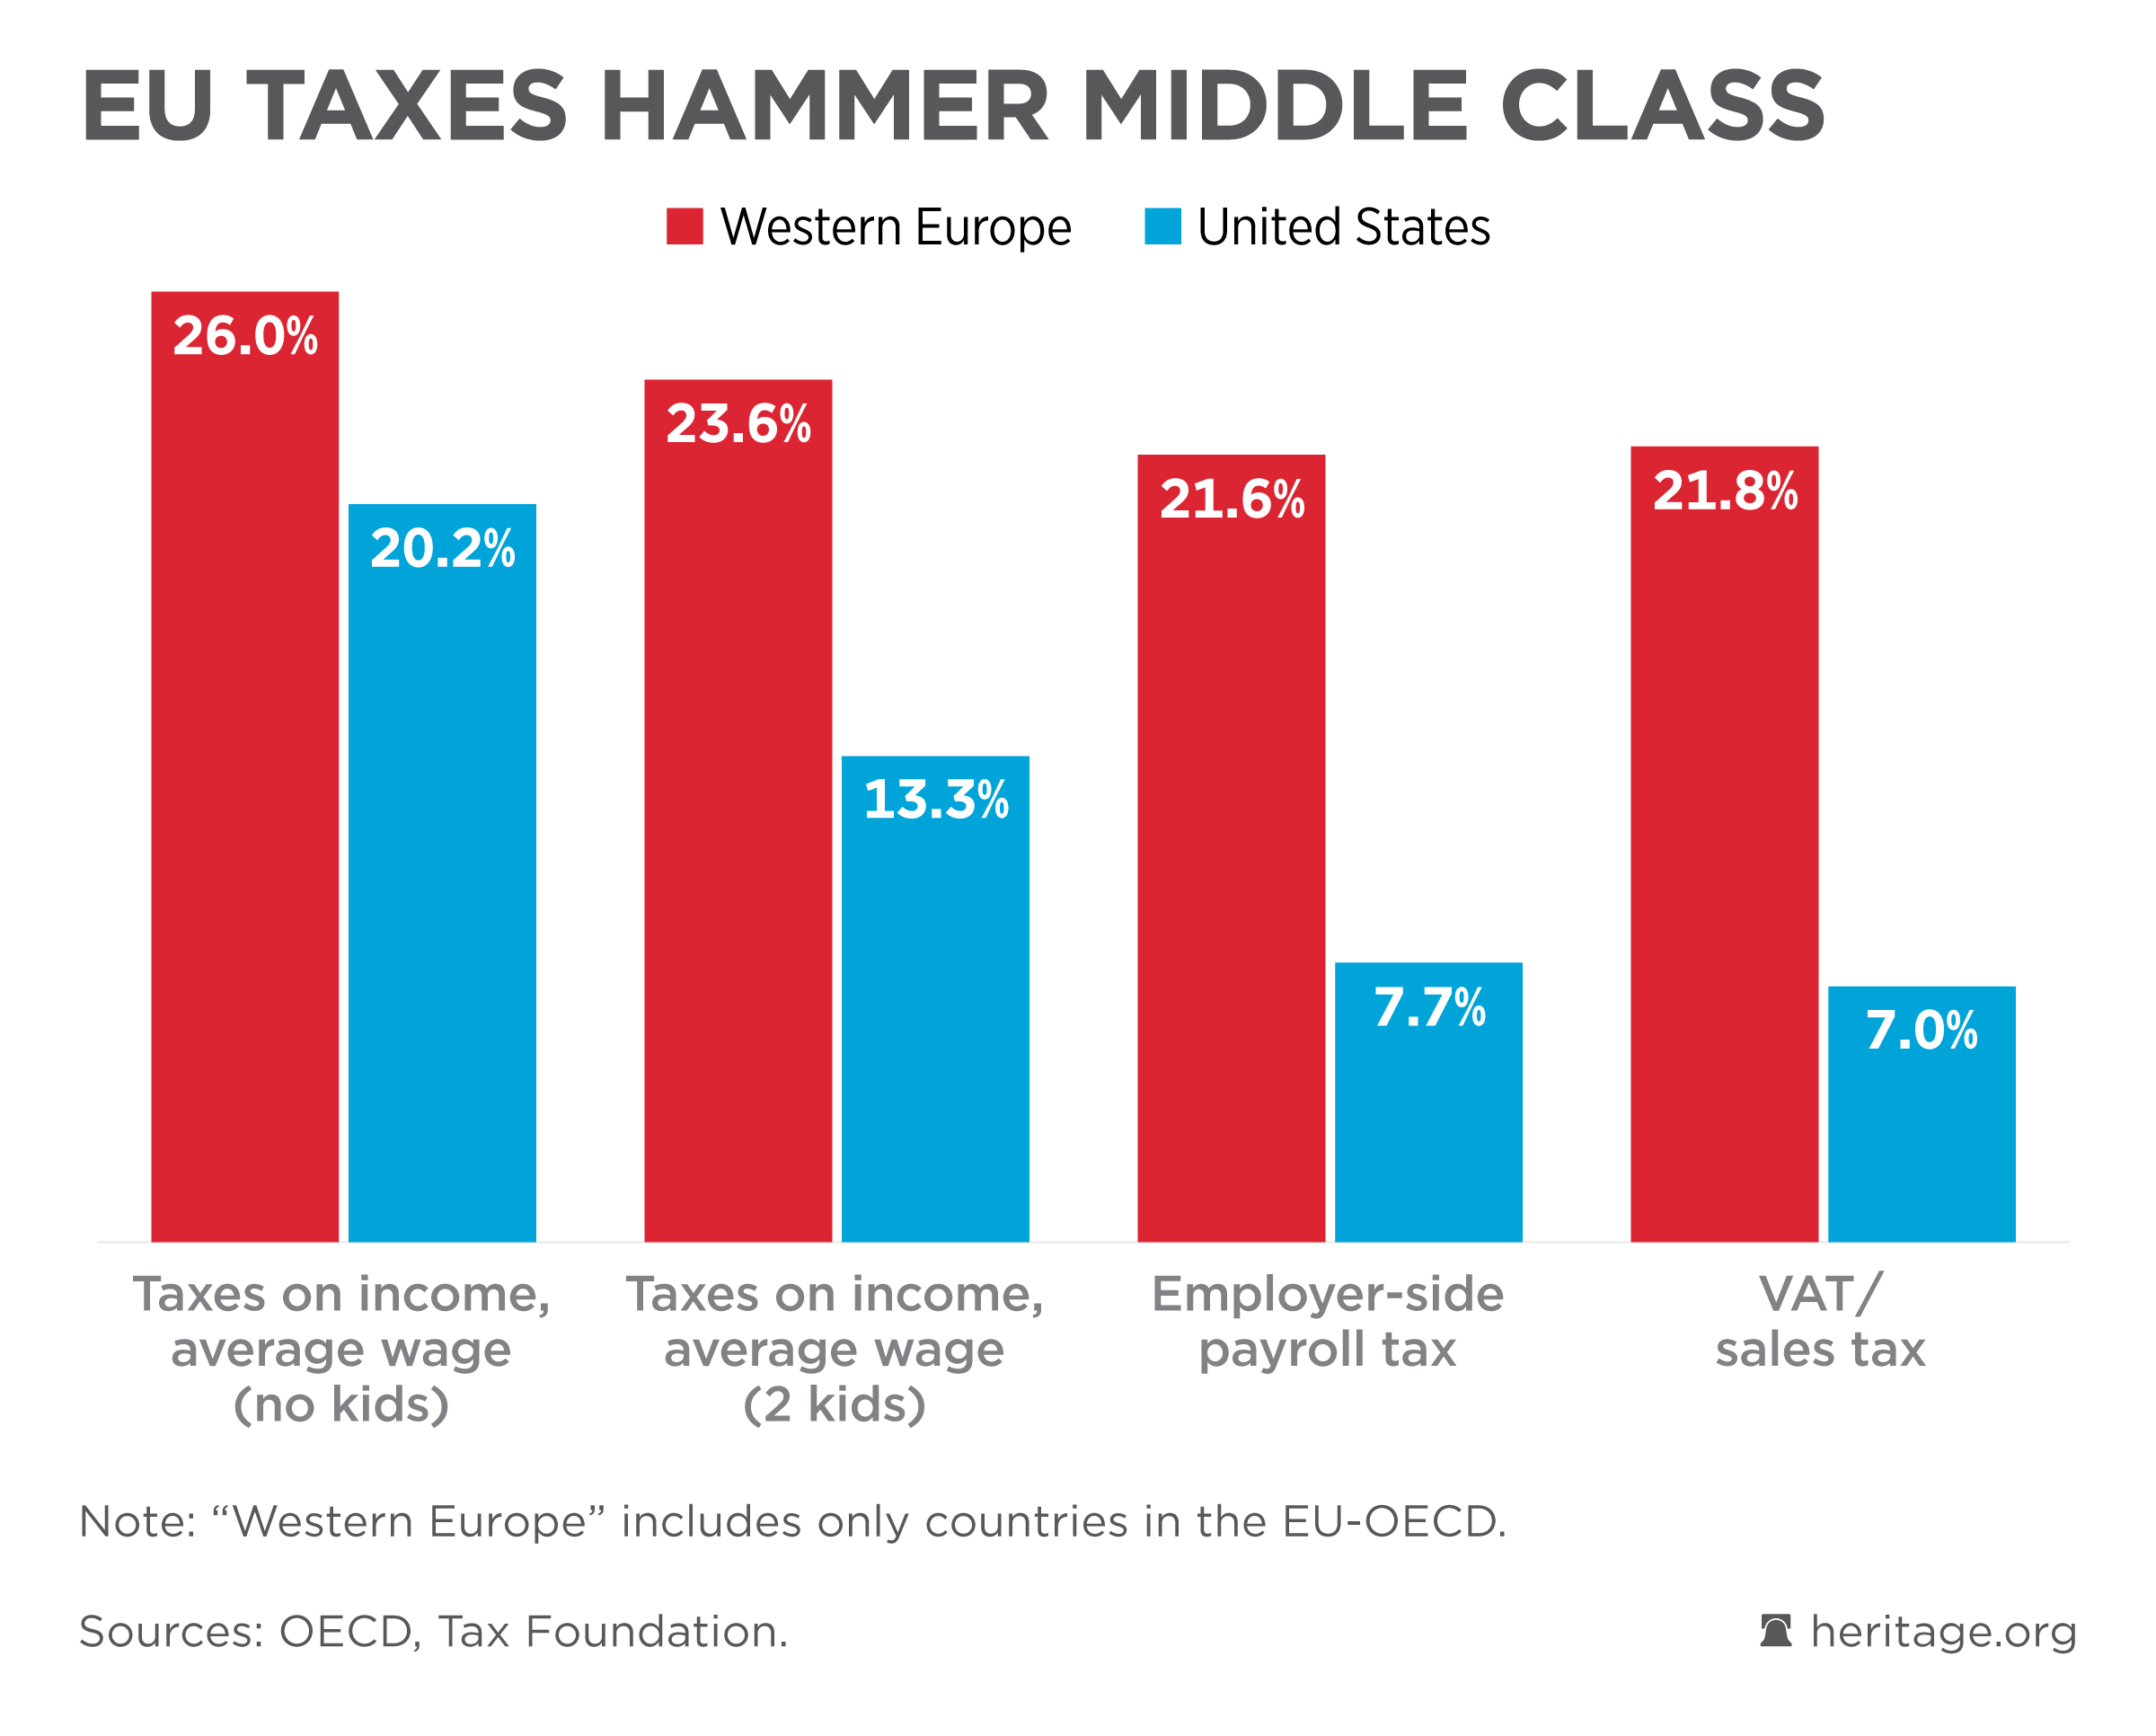