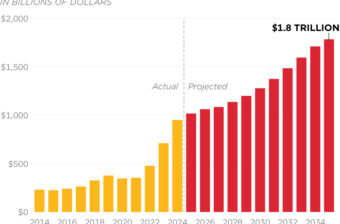
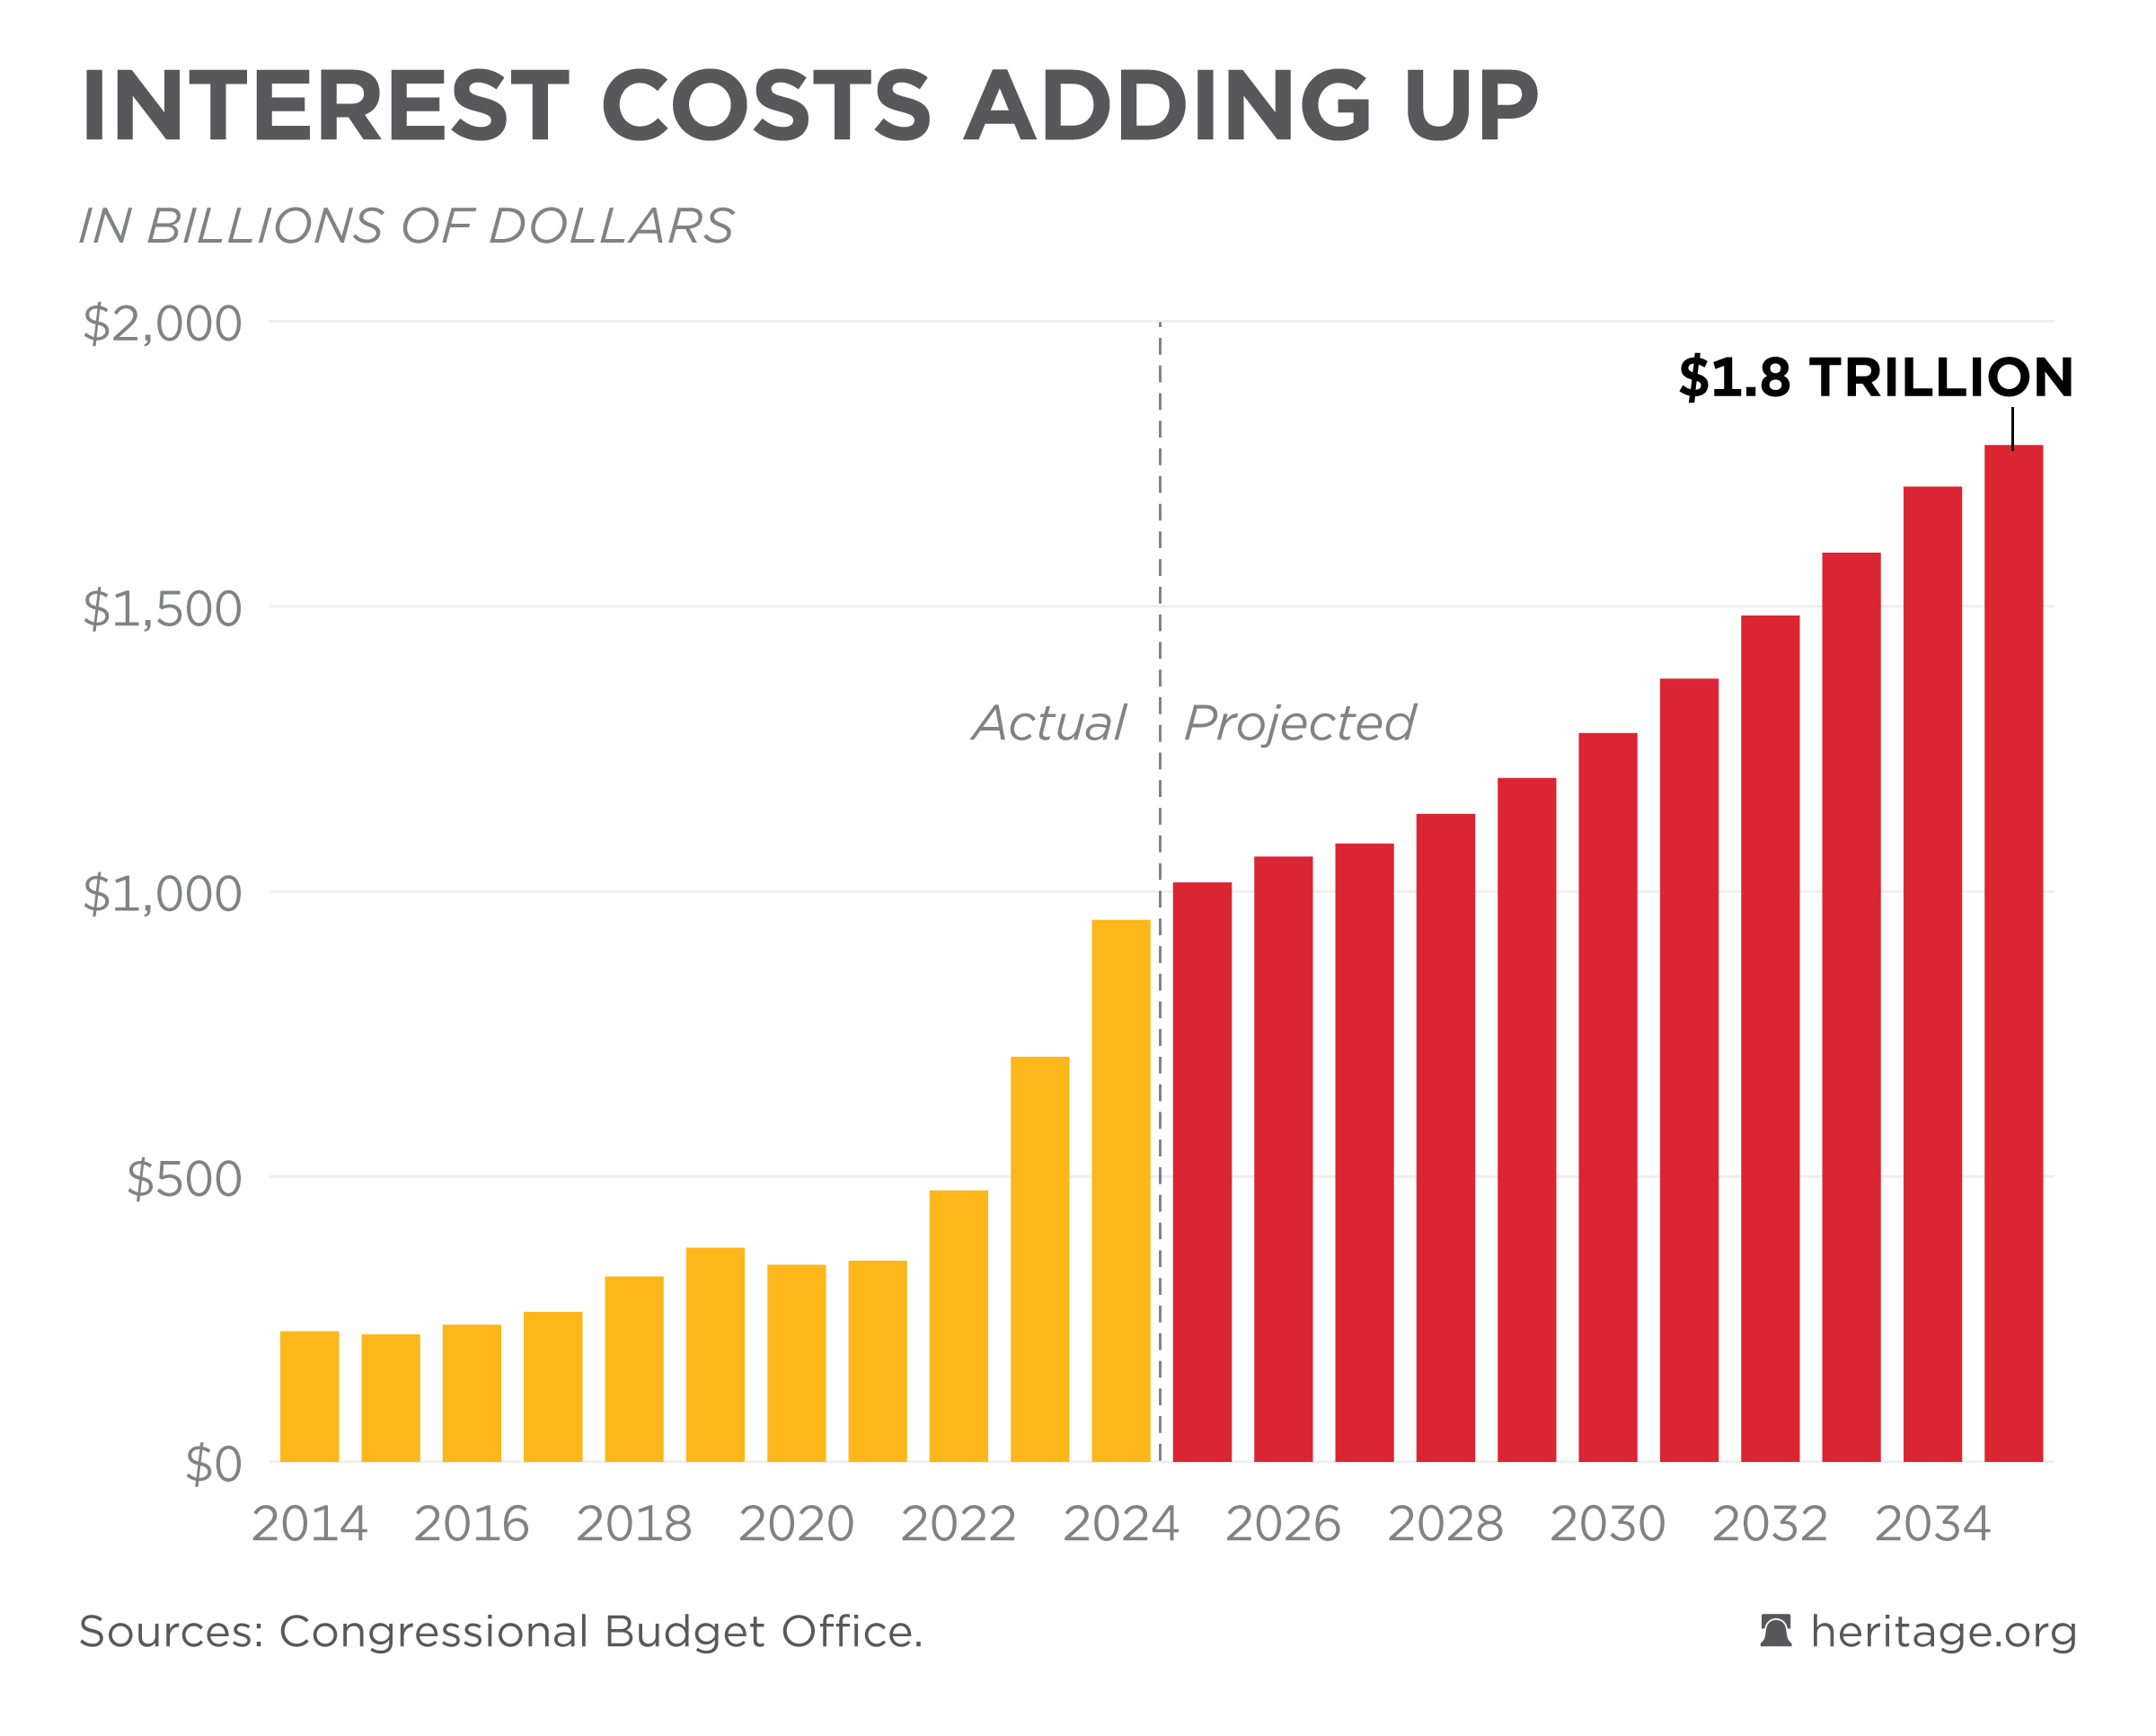
Interest Costs Adding Up
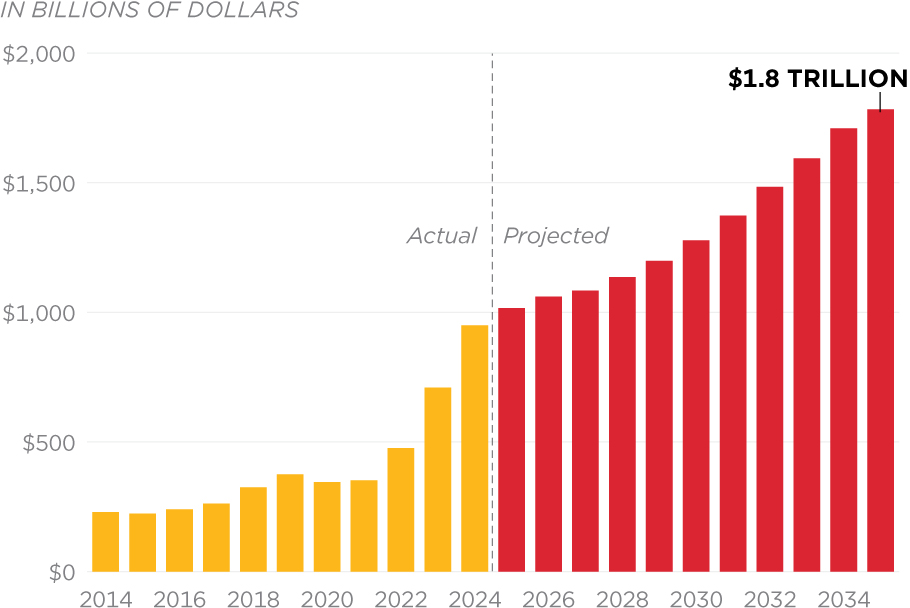
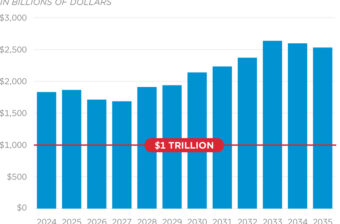
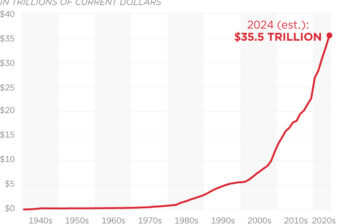
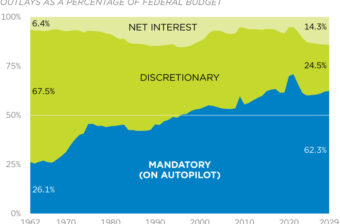
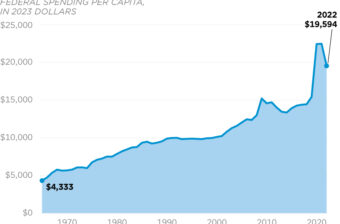
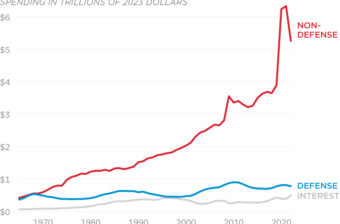
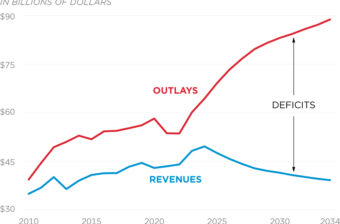
The cost of interest on the national debt has surged and could soon exceed $1 trillion per year. This will act as a permanent drag on the economy until Congress is willing to address unsustainable deficit spending.
Updated January 27, 2025
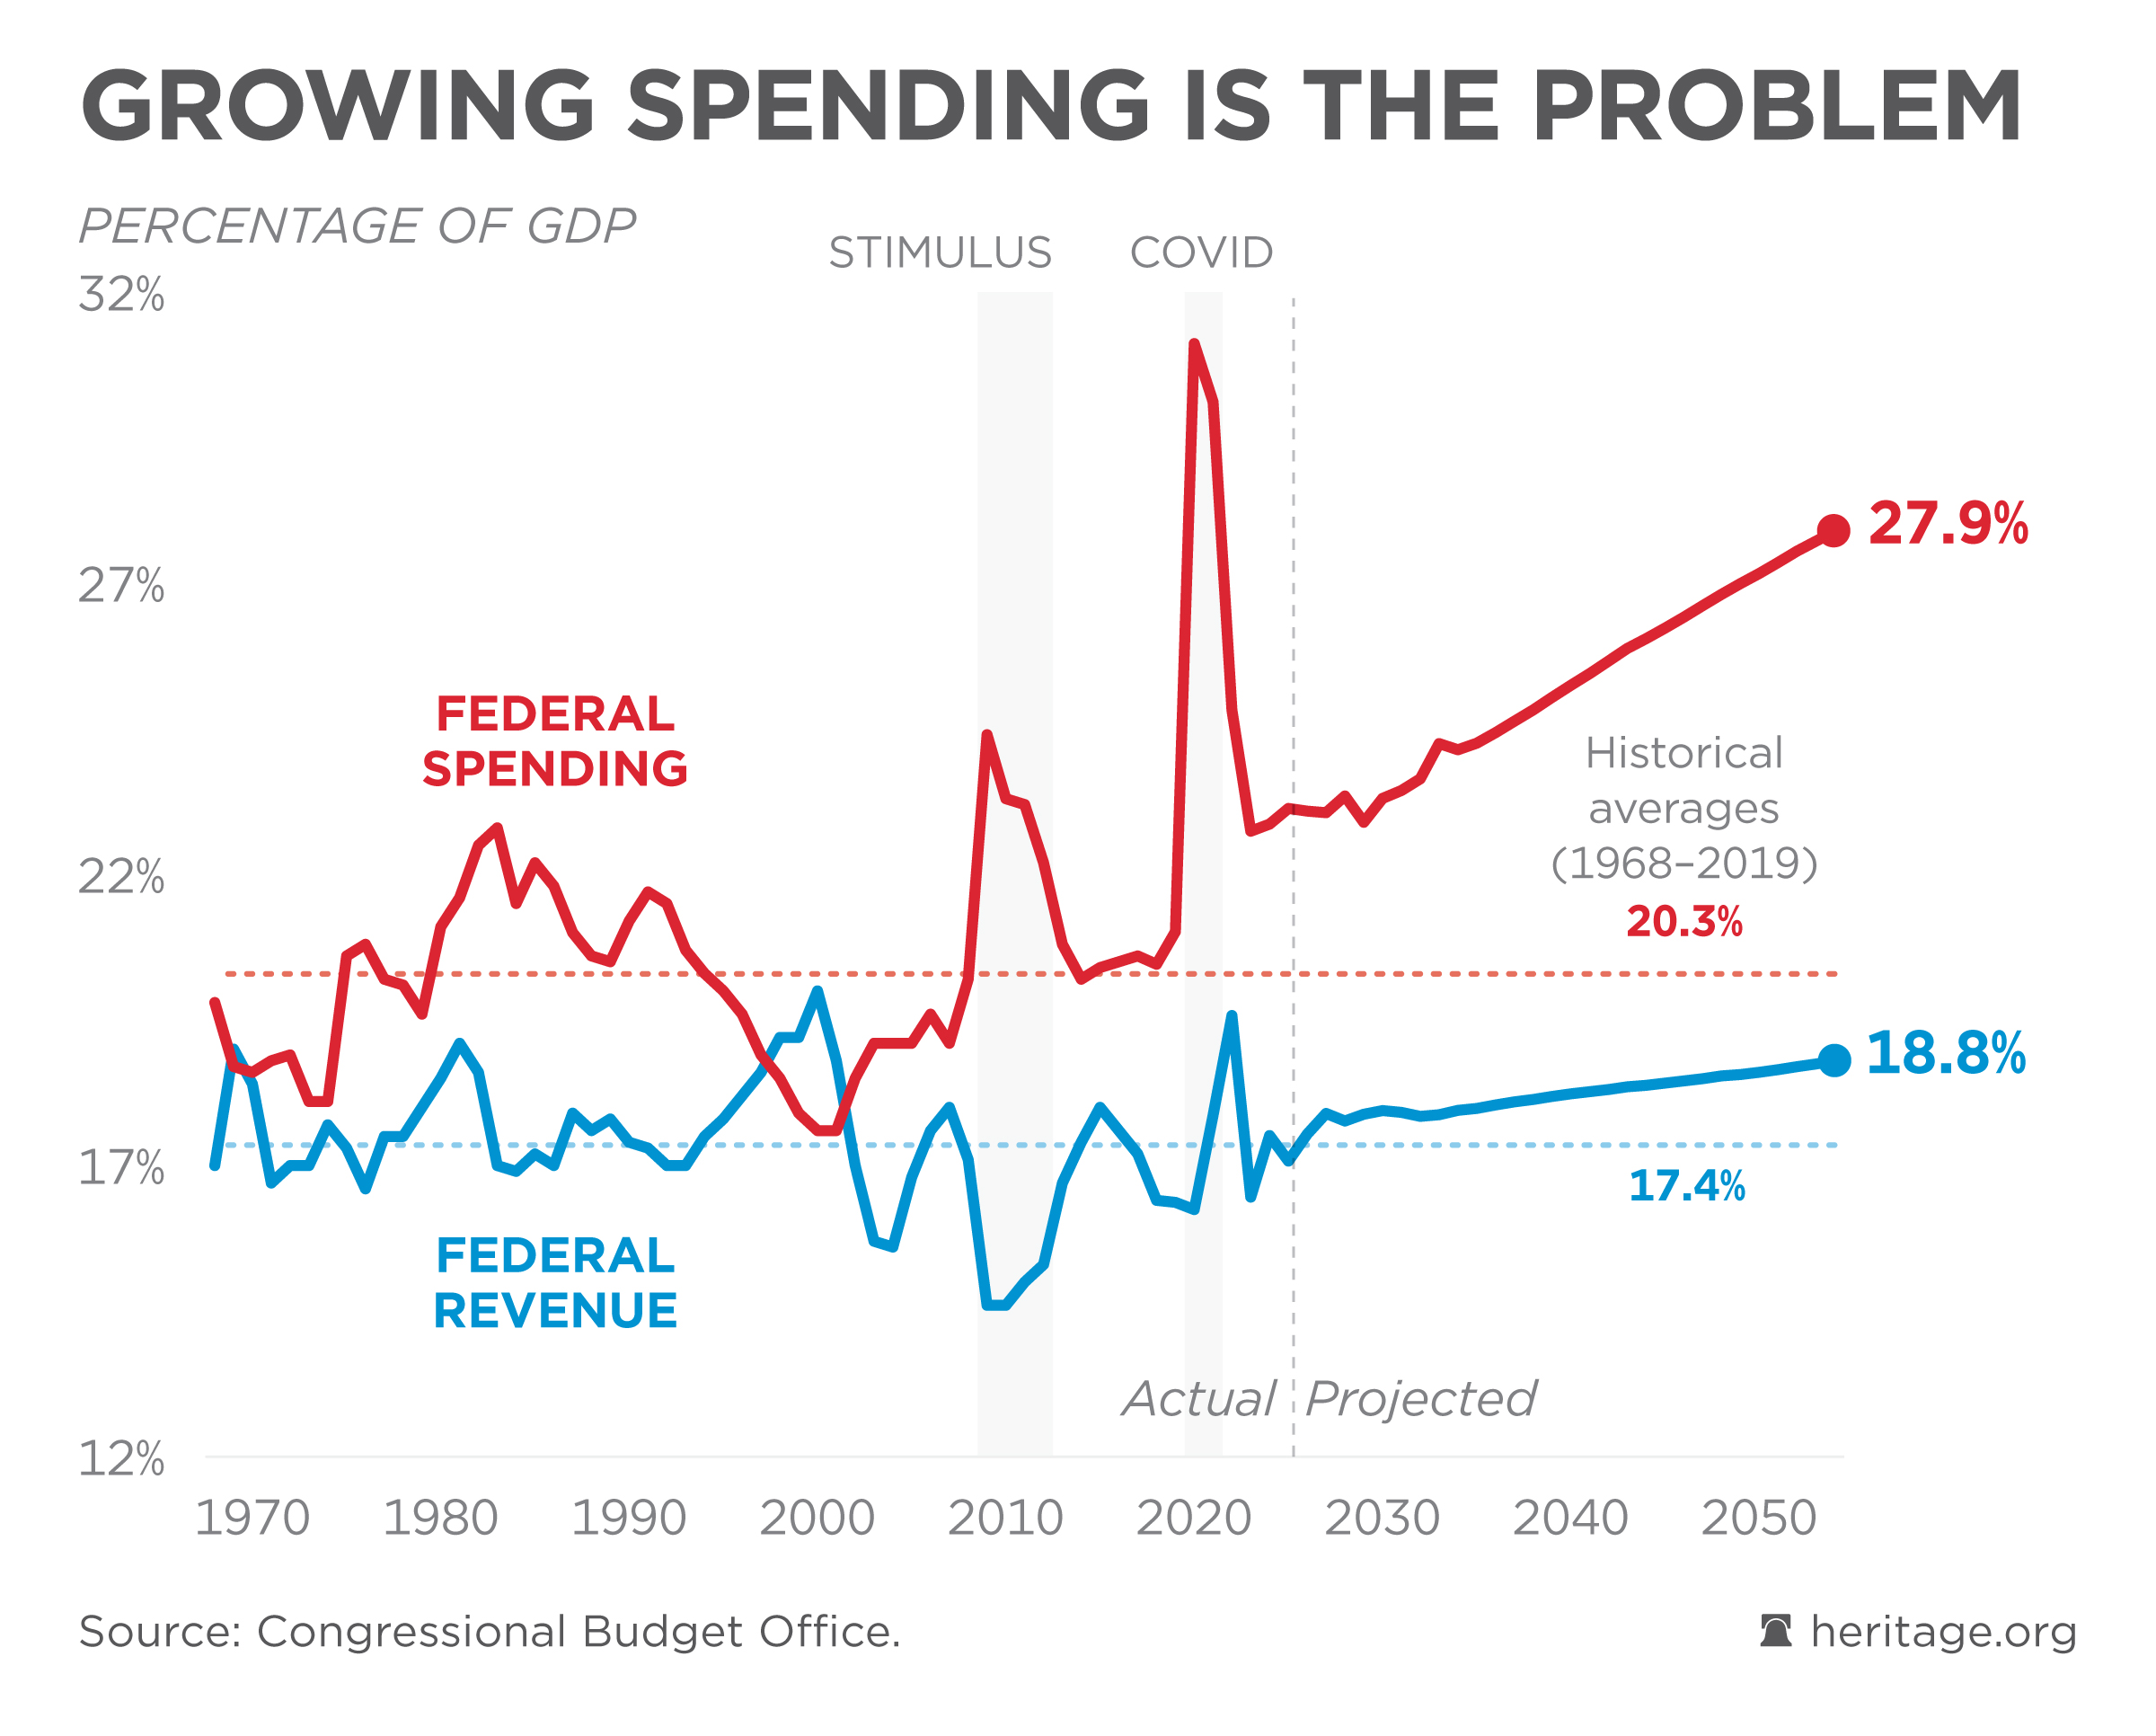
Source: Congressional Budget Office


