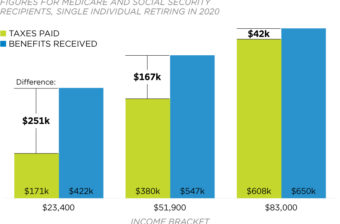
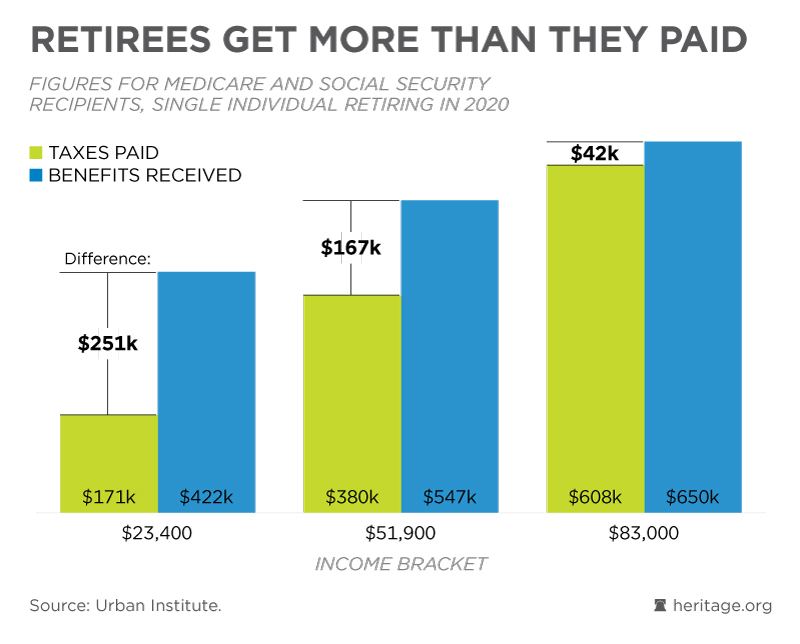
Retirees Typically Receive More than They Paid

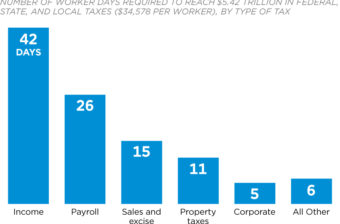
Lower- and middle-income Americans who work every year from ages 22 to 65 will pay between $171,000 and $608,000 in payroll taxes for Medicare and Social Security, depending on their income bracket. And though they will receive more in Medicare and Social Security benefits than they paid for, Social Security is a bad deal for workers and their families because they could receive two- to three-times as much, on average, from saving and investing their own money, without adding to the debt burden for younger generations.
Updated May 10, 2019
Source: Urban Institute
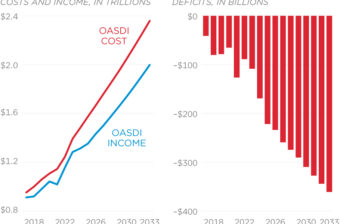
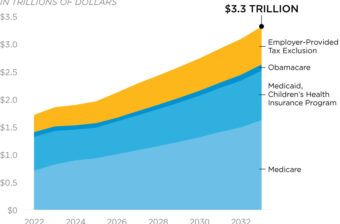
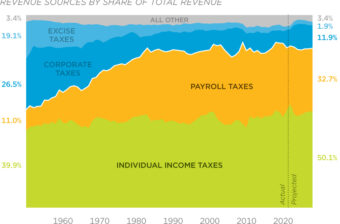
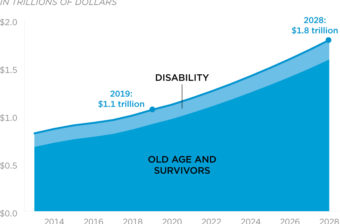
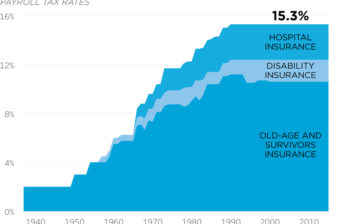
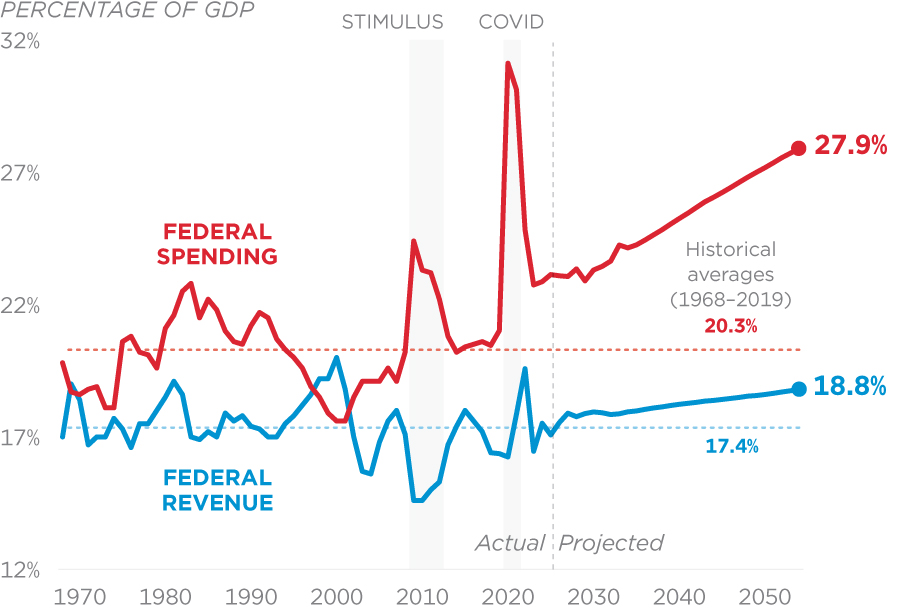
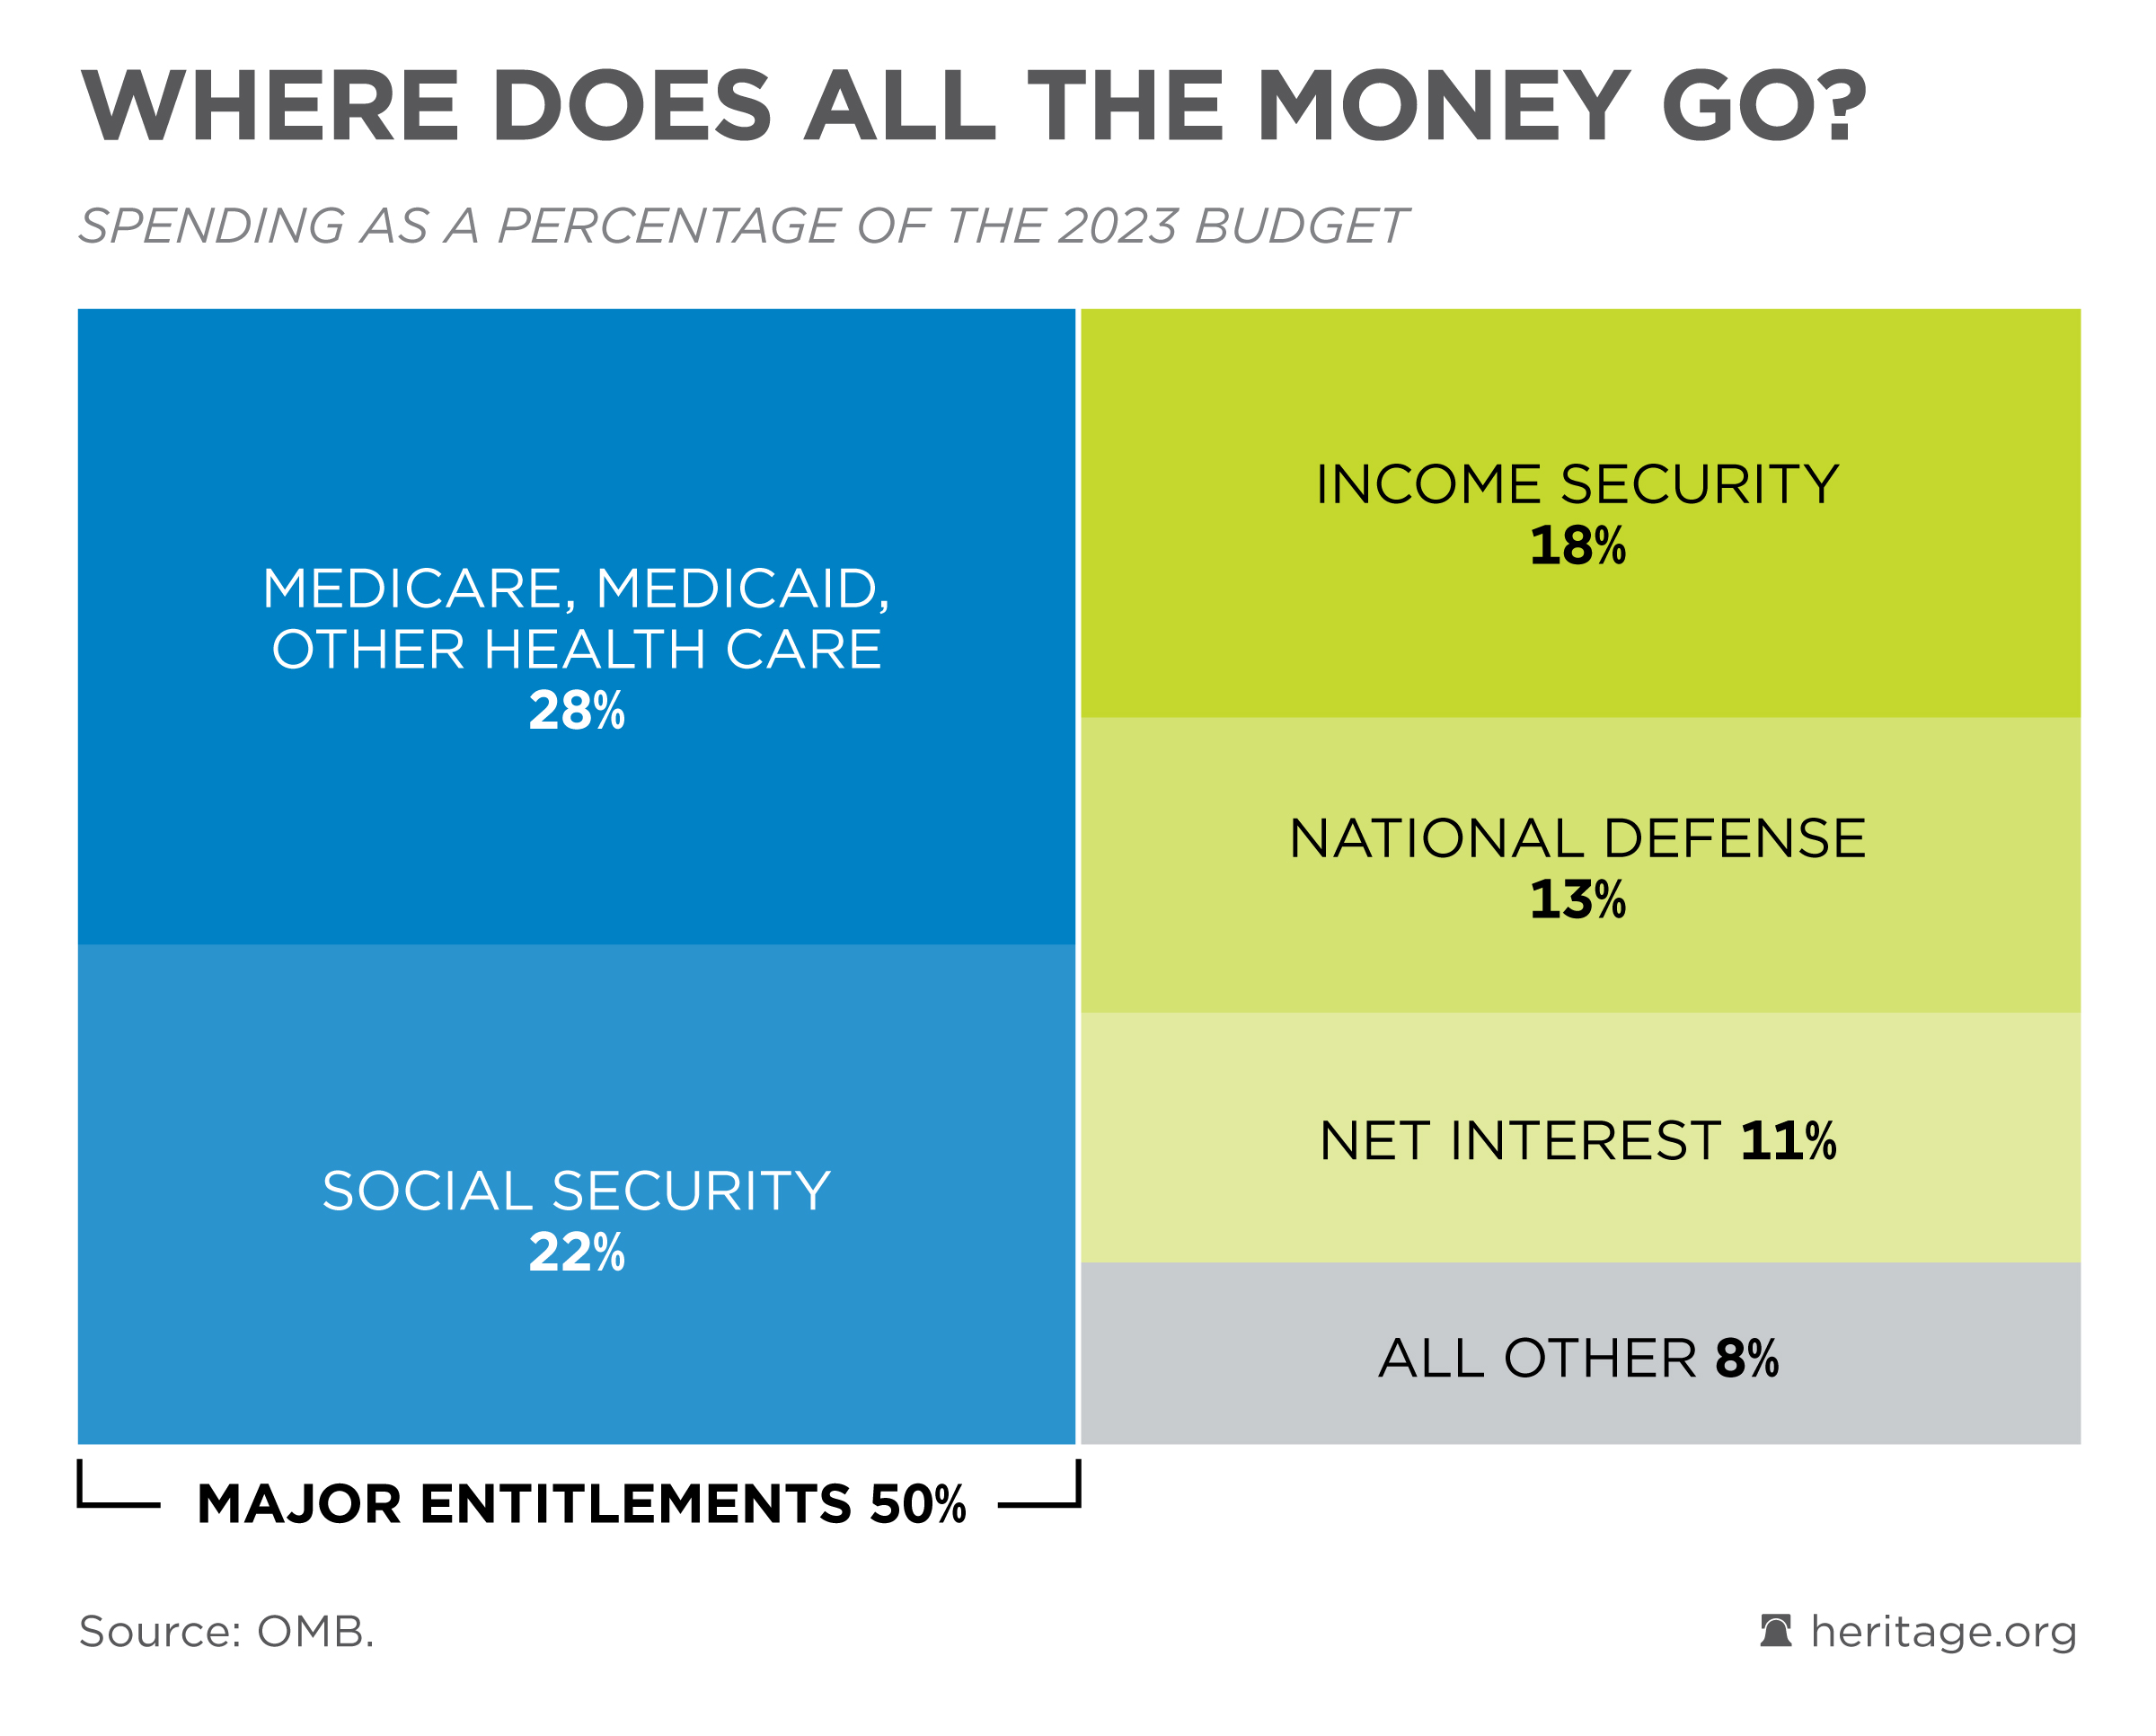
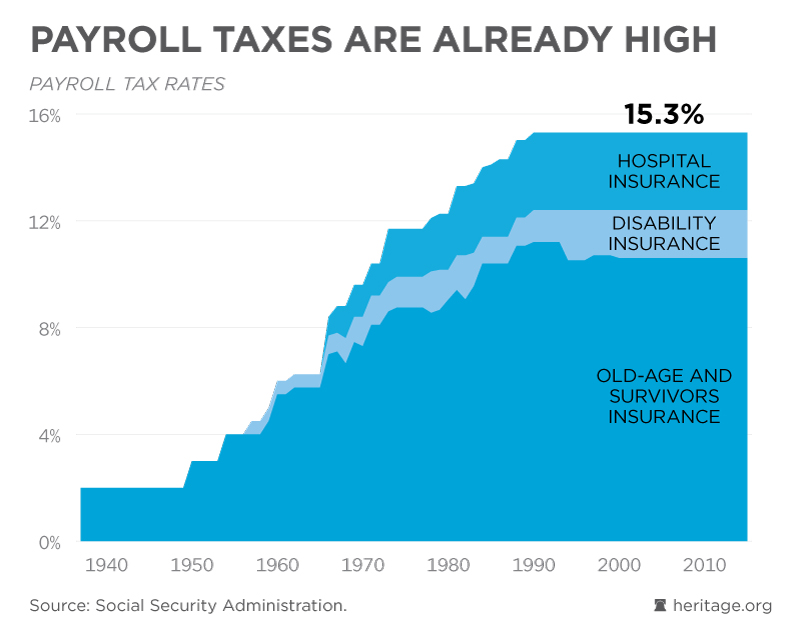
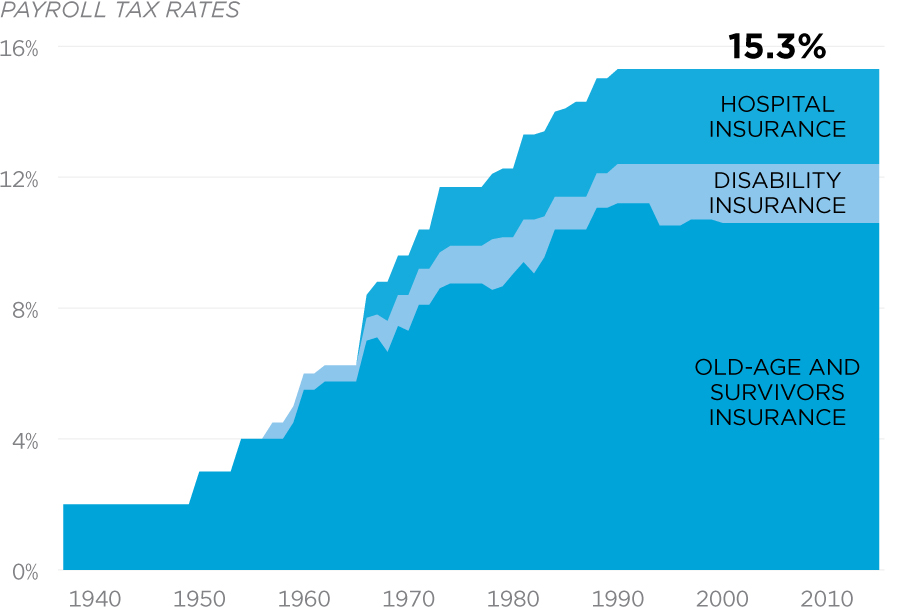 Without reforms, spending on Medicare and Social Security is threatening even higher payroll taxes for workers.