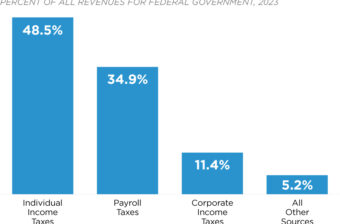
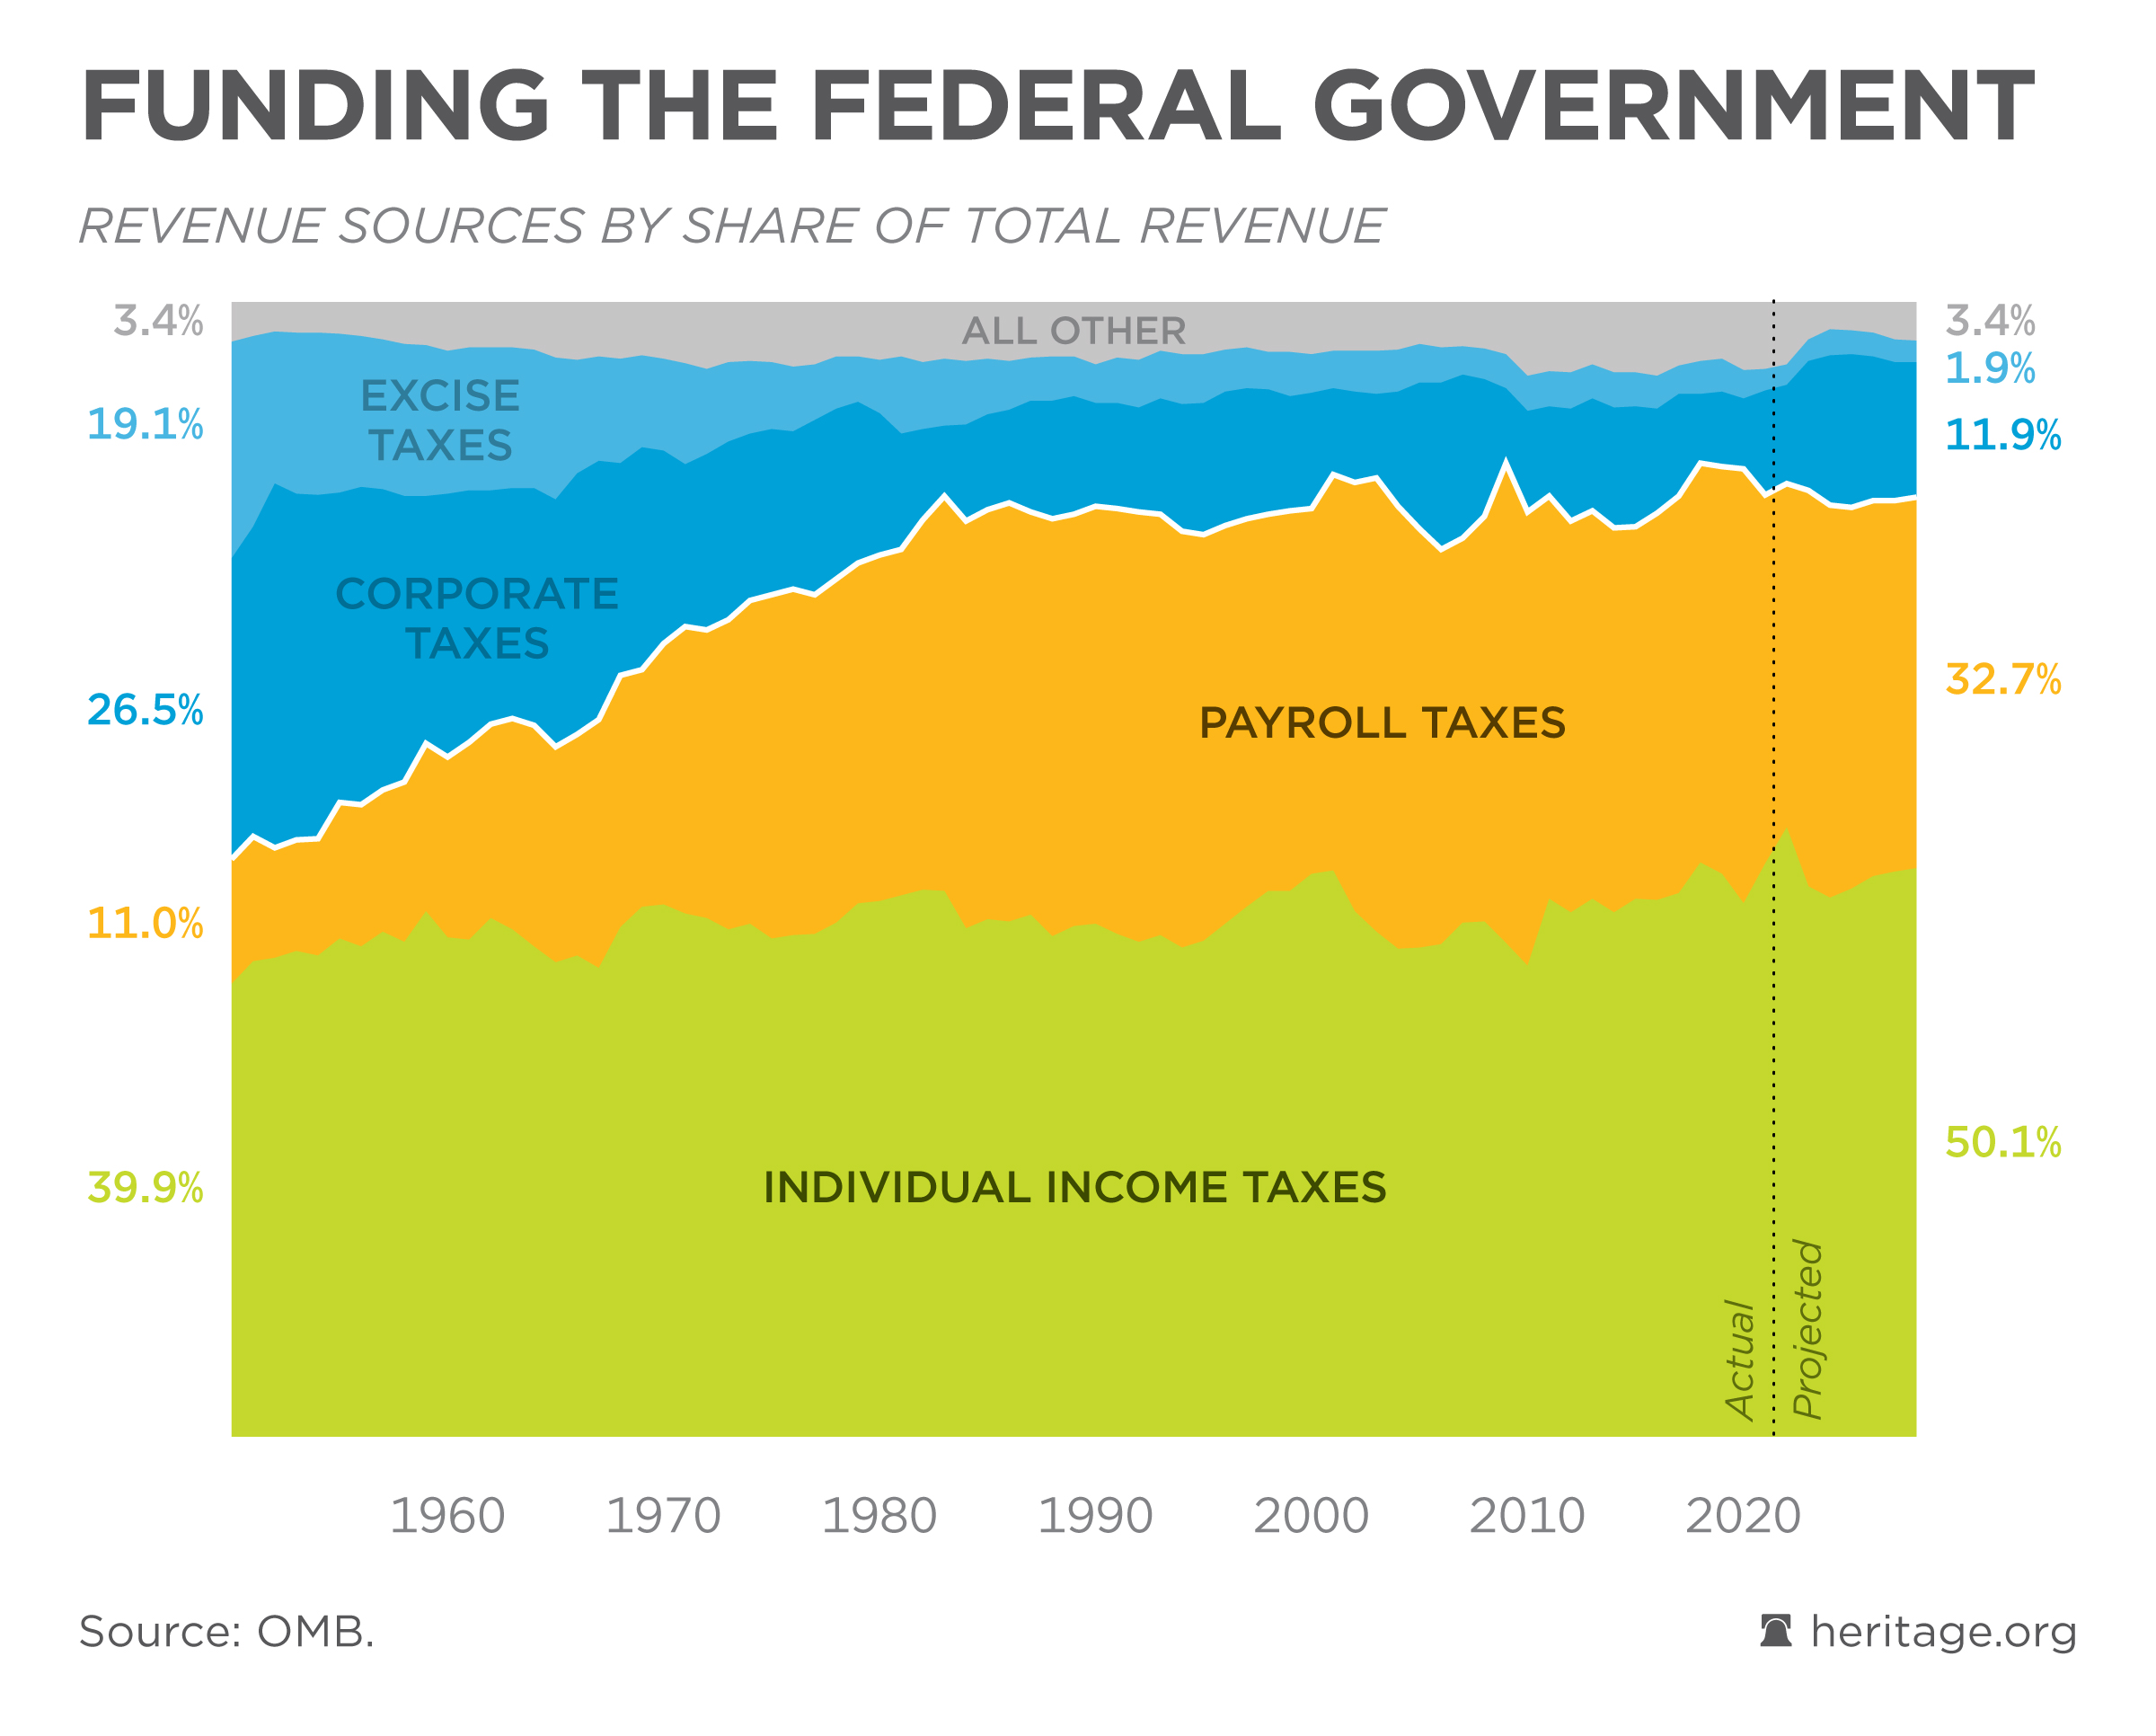
Funding the Federal Government
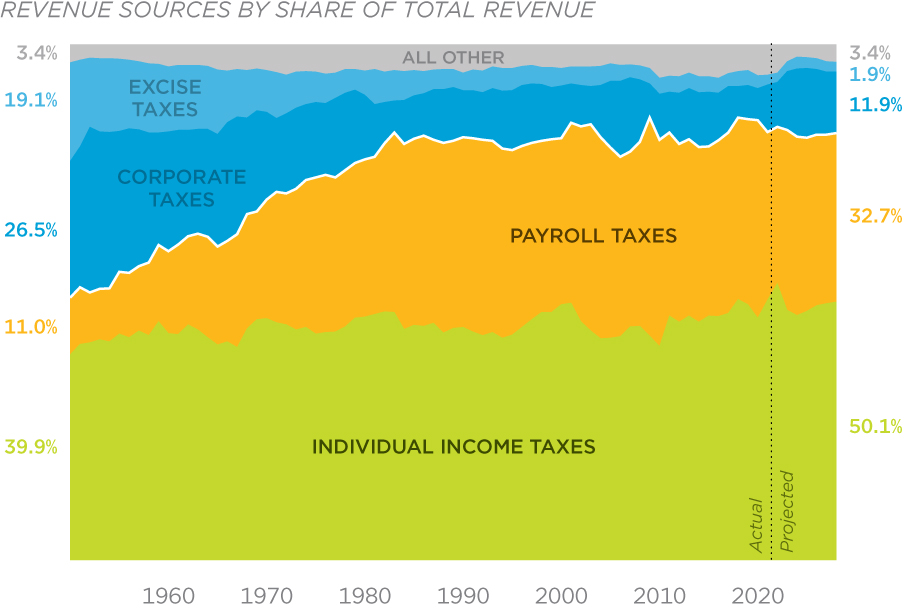
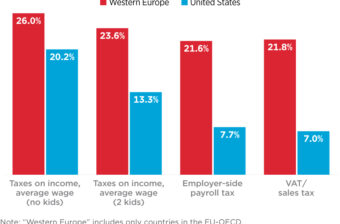
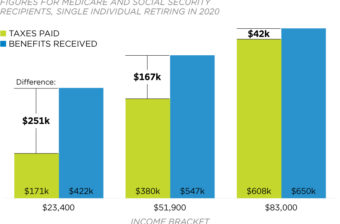
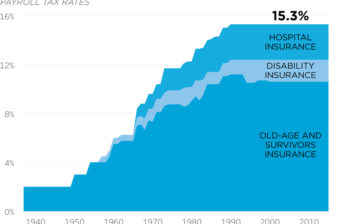
Payroll taxes, those taxes paid by wage earners for Social Security and Medicare, have become an increasingly important revenue source for the federal government.
Updated March 22, 2023
Source: OMB
Payroll taxes, those taxes paid by wage earners for Social Security and Medicare, have become an increasingly important revenue source for the federal government.
Updated March 22, 2023
Source: OMB
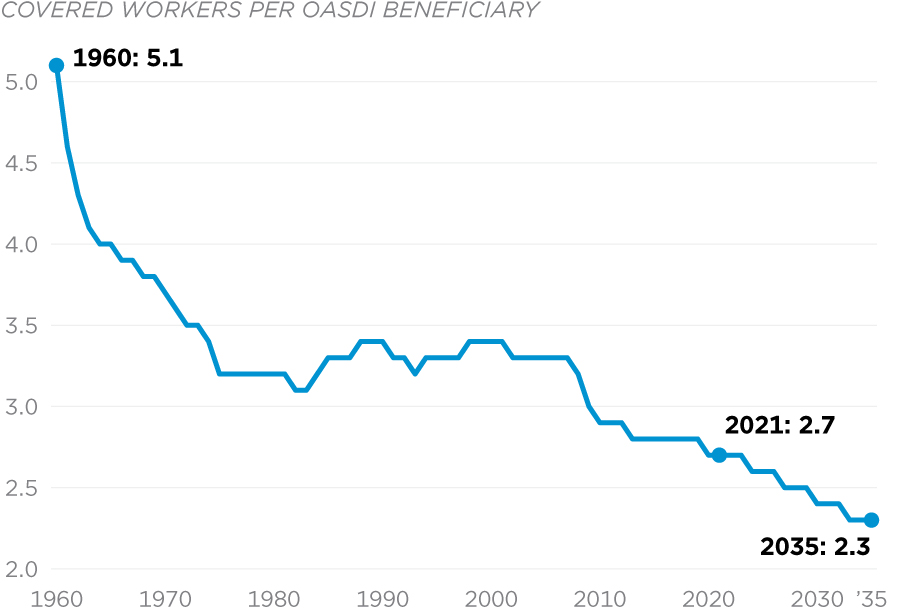
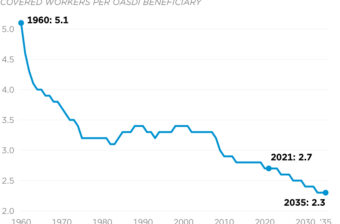
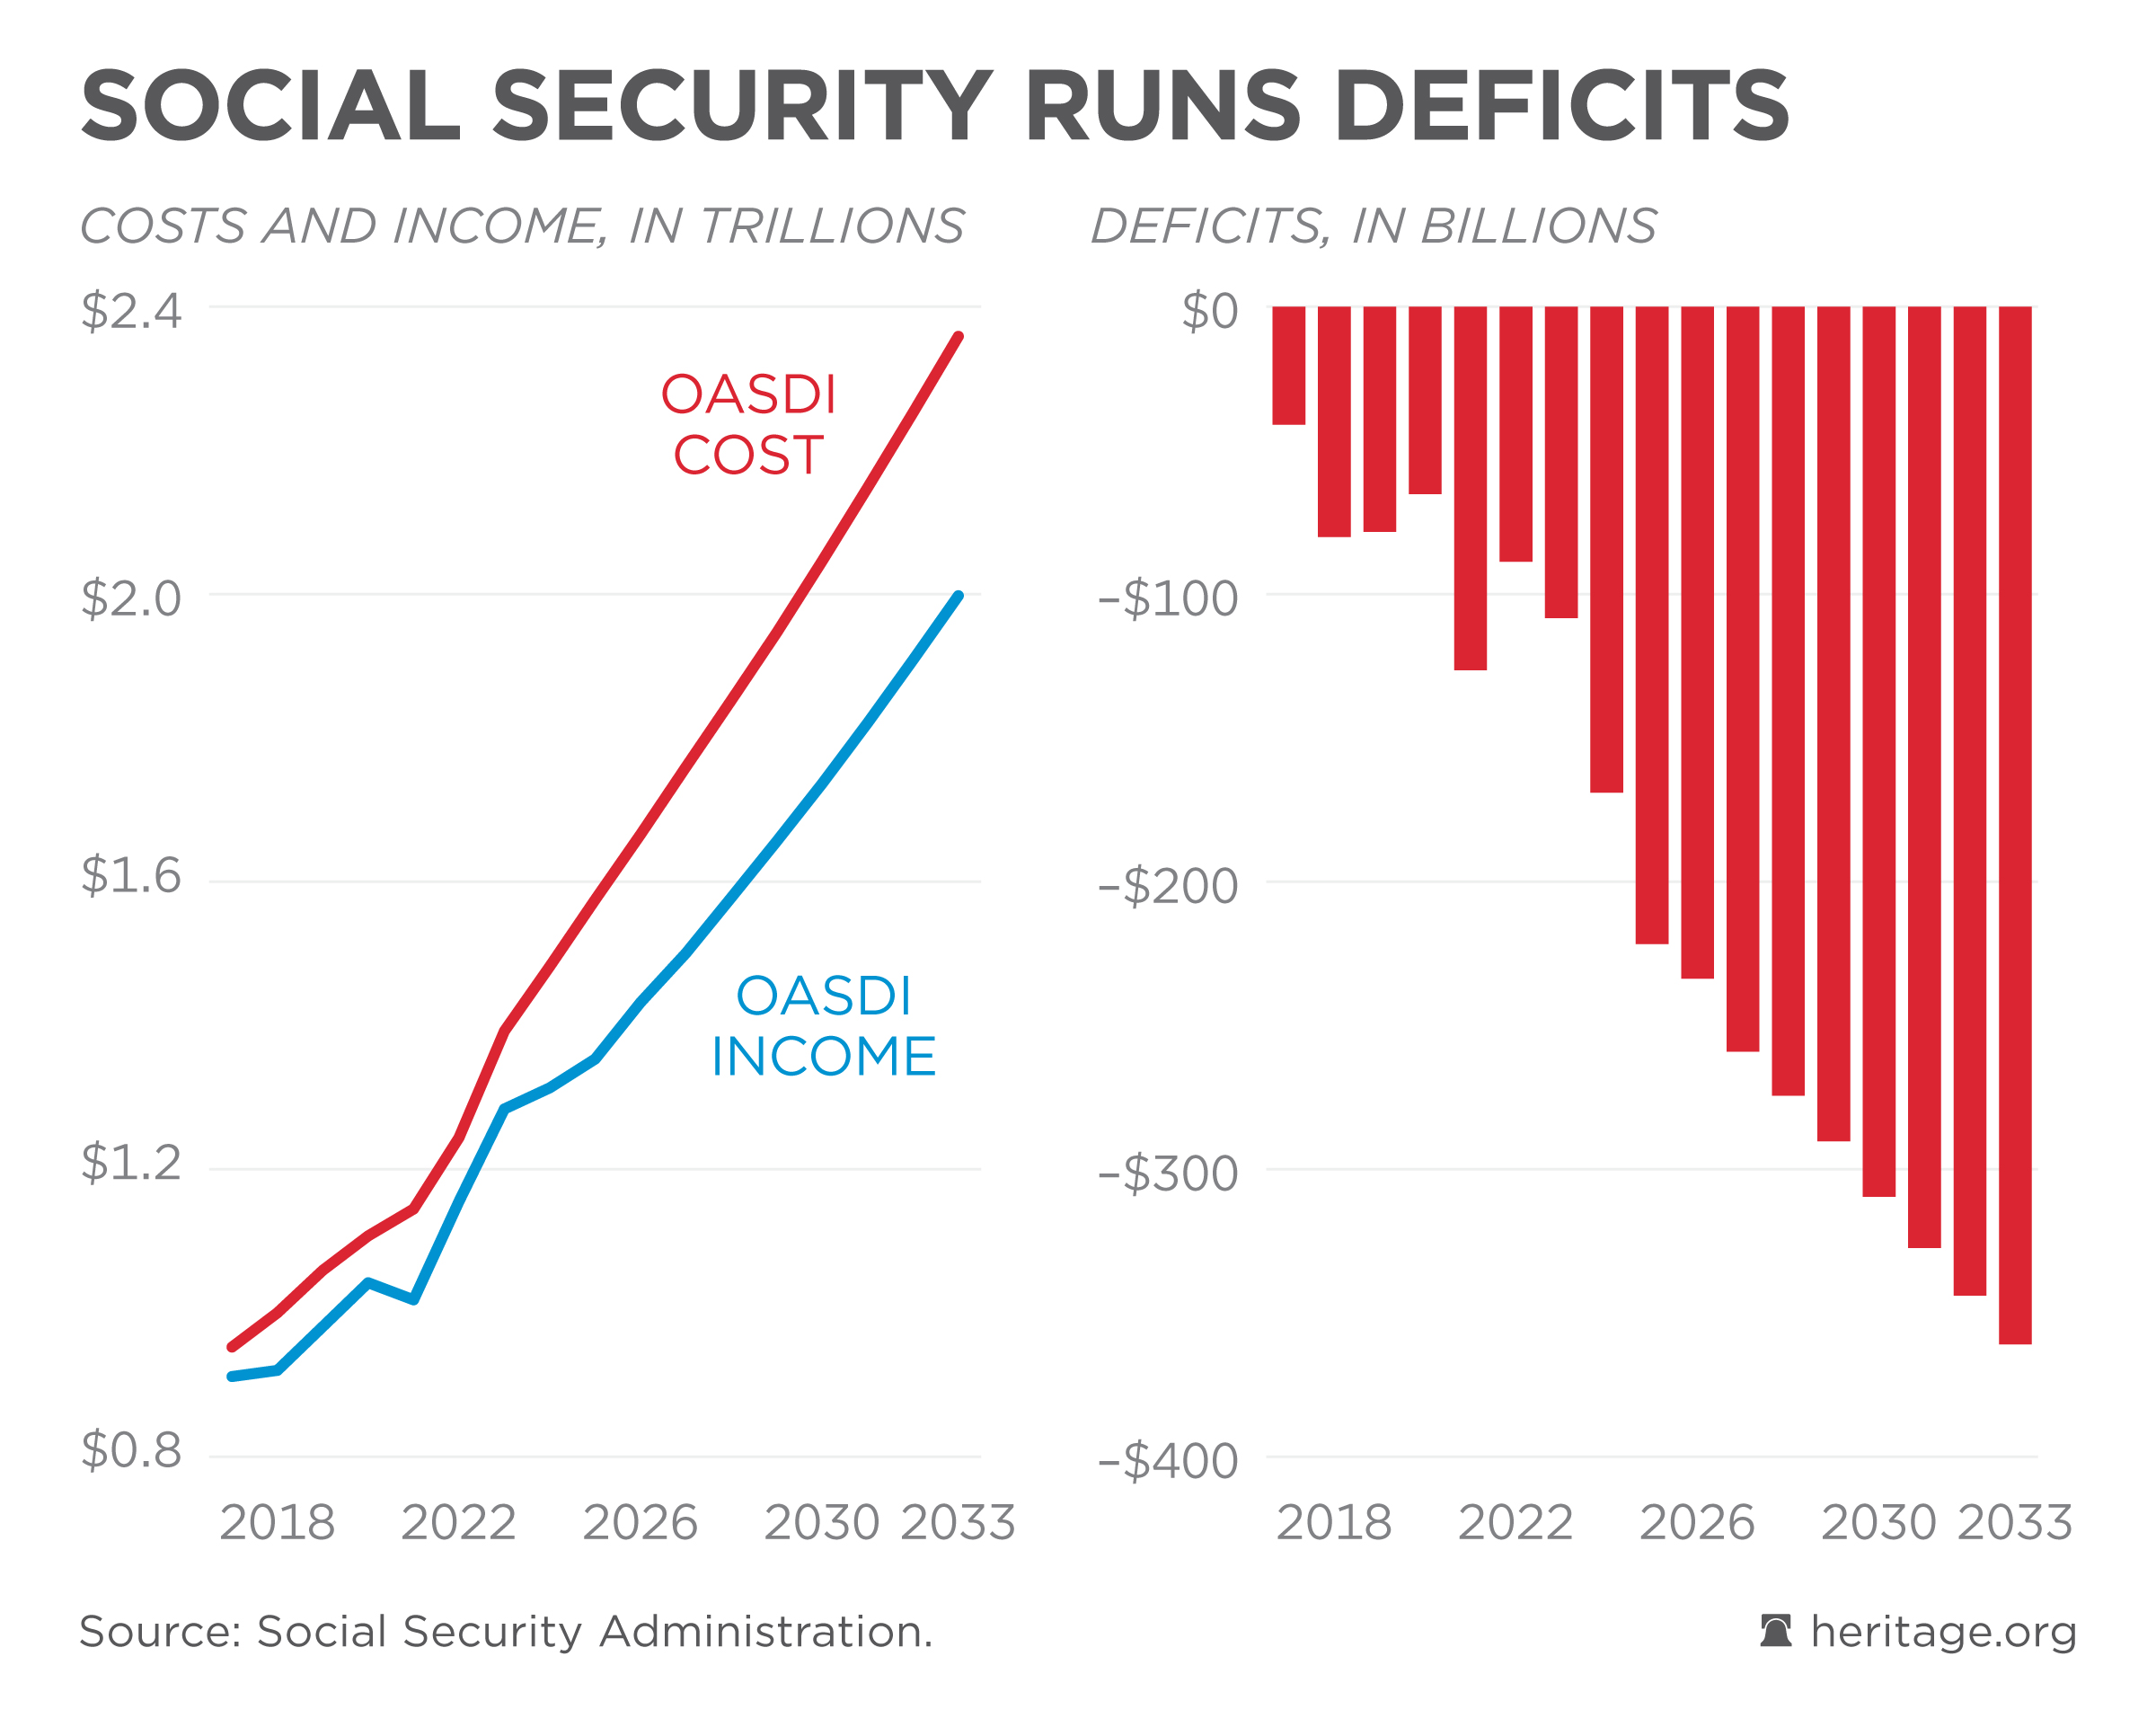
Social Security’s main programs, the Old-Age and Survivors Insurance and Disability Insurance programs (OASDI), have been expanded to include more beneficiaries. As American society has continued aging, the number of covered workers per OASDI beneficiary has steadily fallen. OASDI is facing persistent deficits and must be reformed before it becomes insolvent in 2034.
Updated December 7, 2021
Source: Social Security Administration
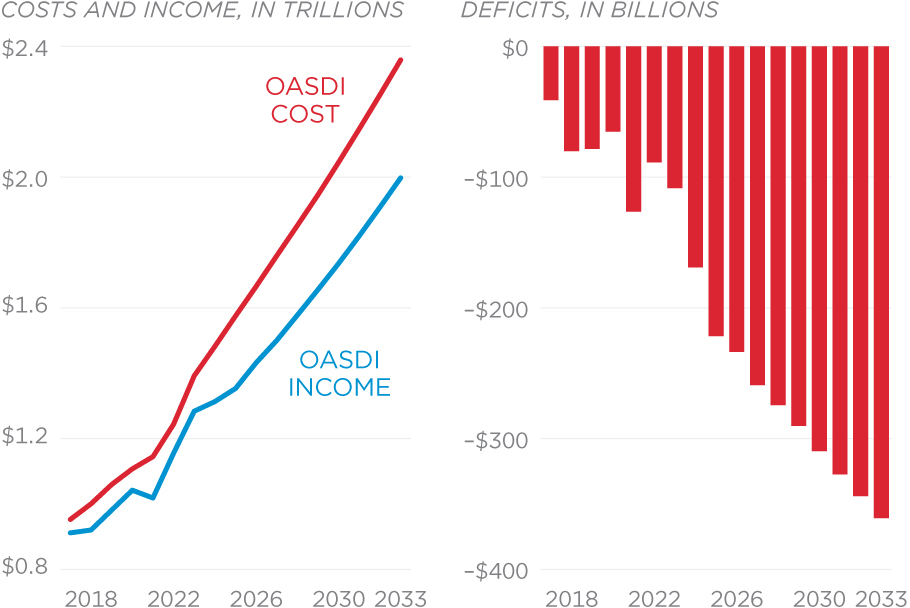
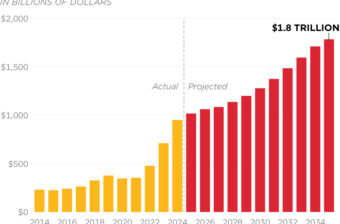
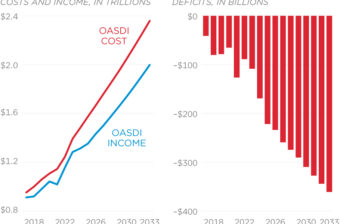
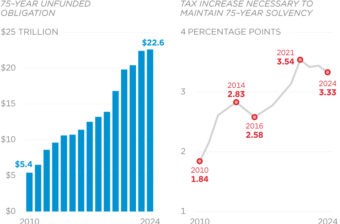
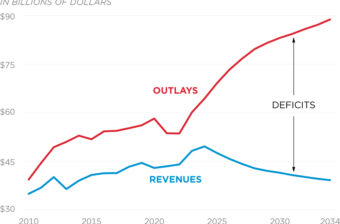
Social Security runs consecutive and permanent cash-flow deficits. Without program reforms, this gap between what the Treasury is collecting in payroll and Social Security income taxes and what is needed to pay benefits will grow several times over despite strong tax revenue increases.
Updated July 19, 2024
Source: Social Security Administration
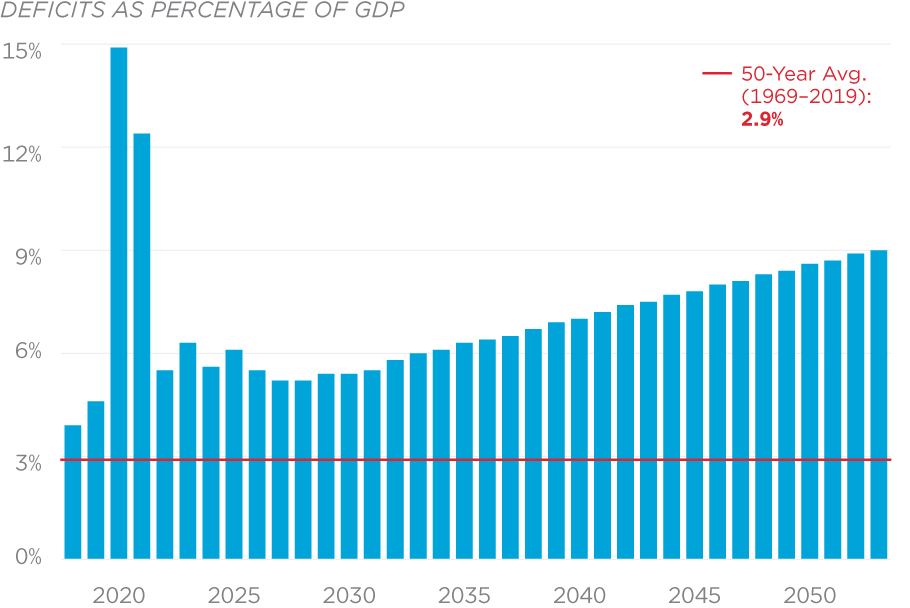
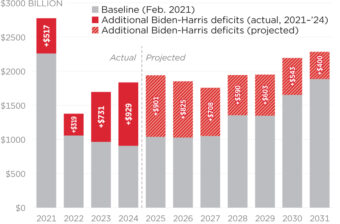
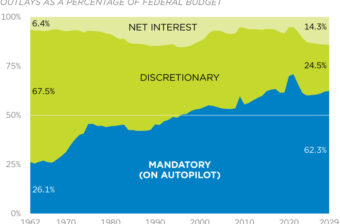
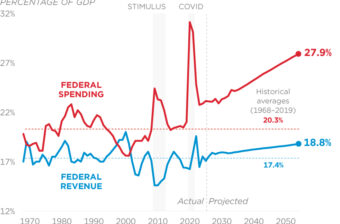
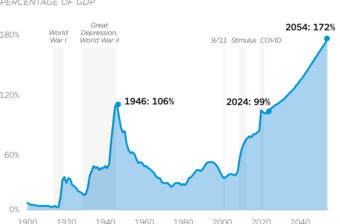
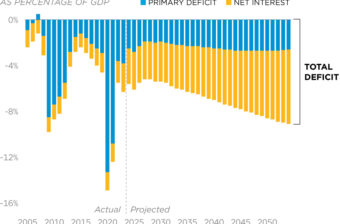
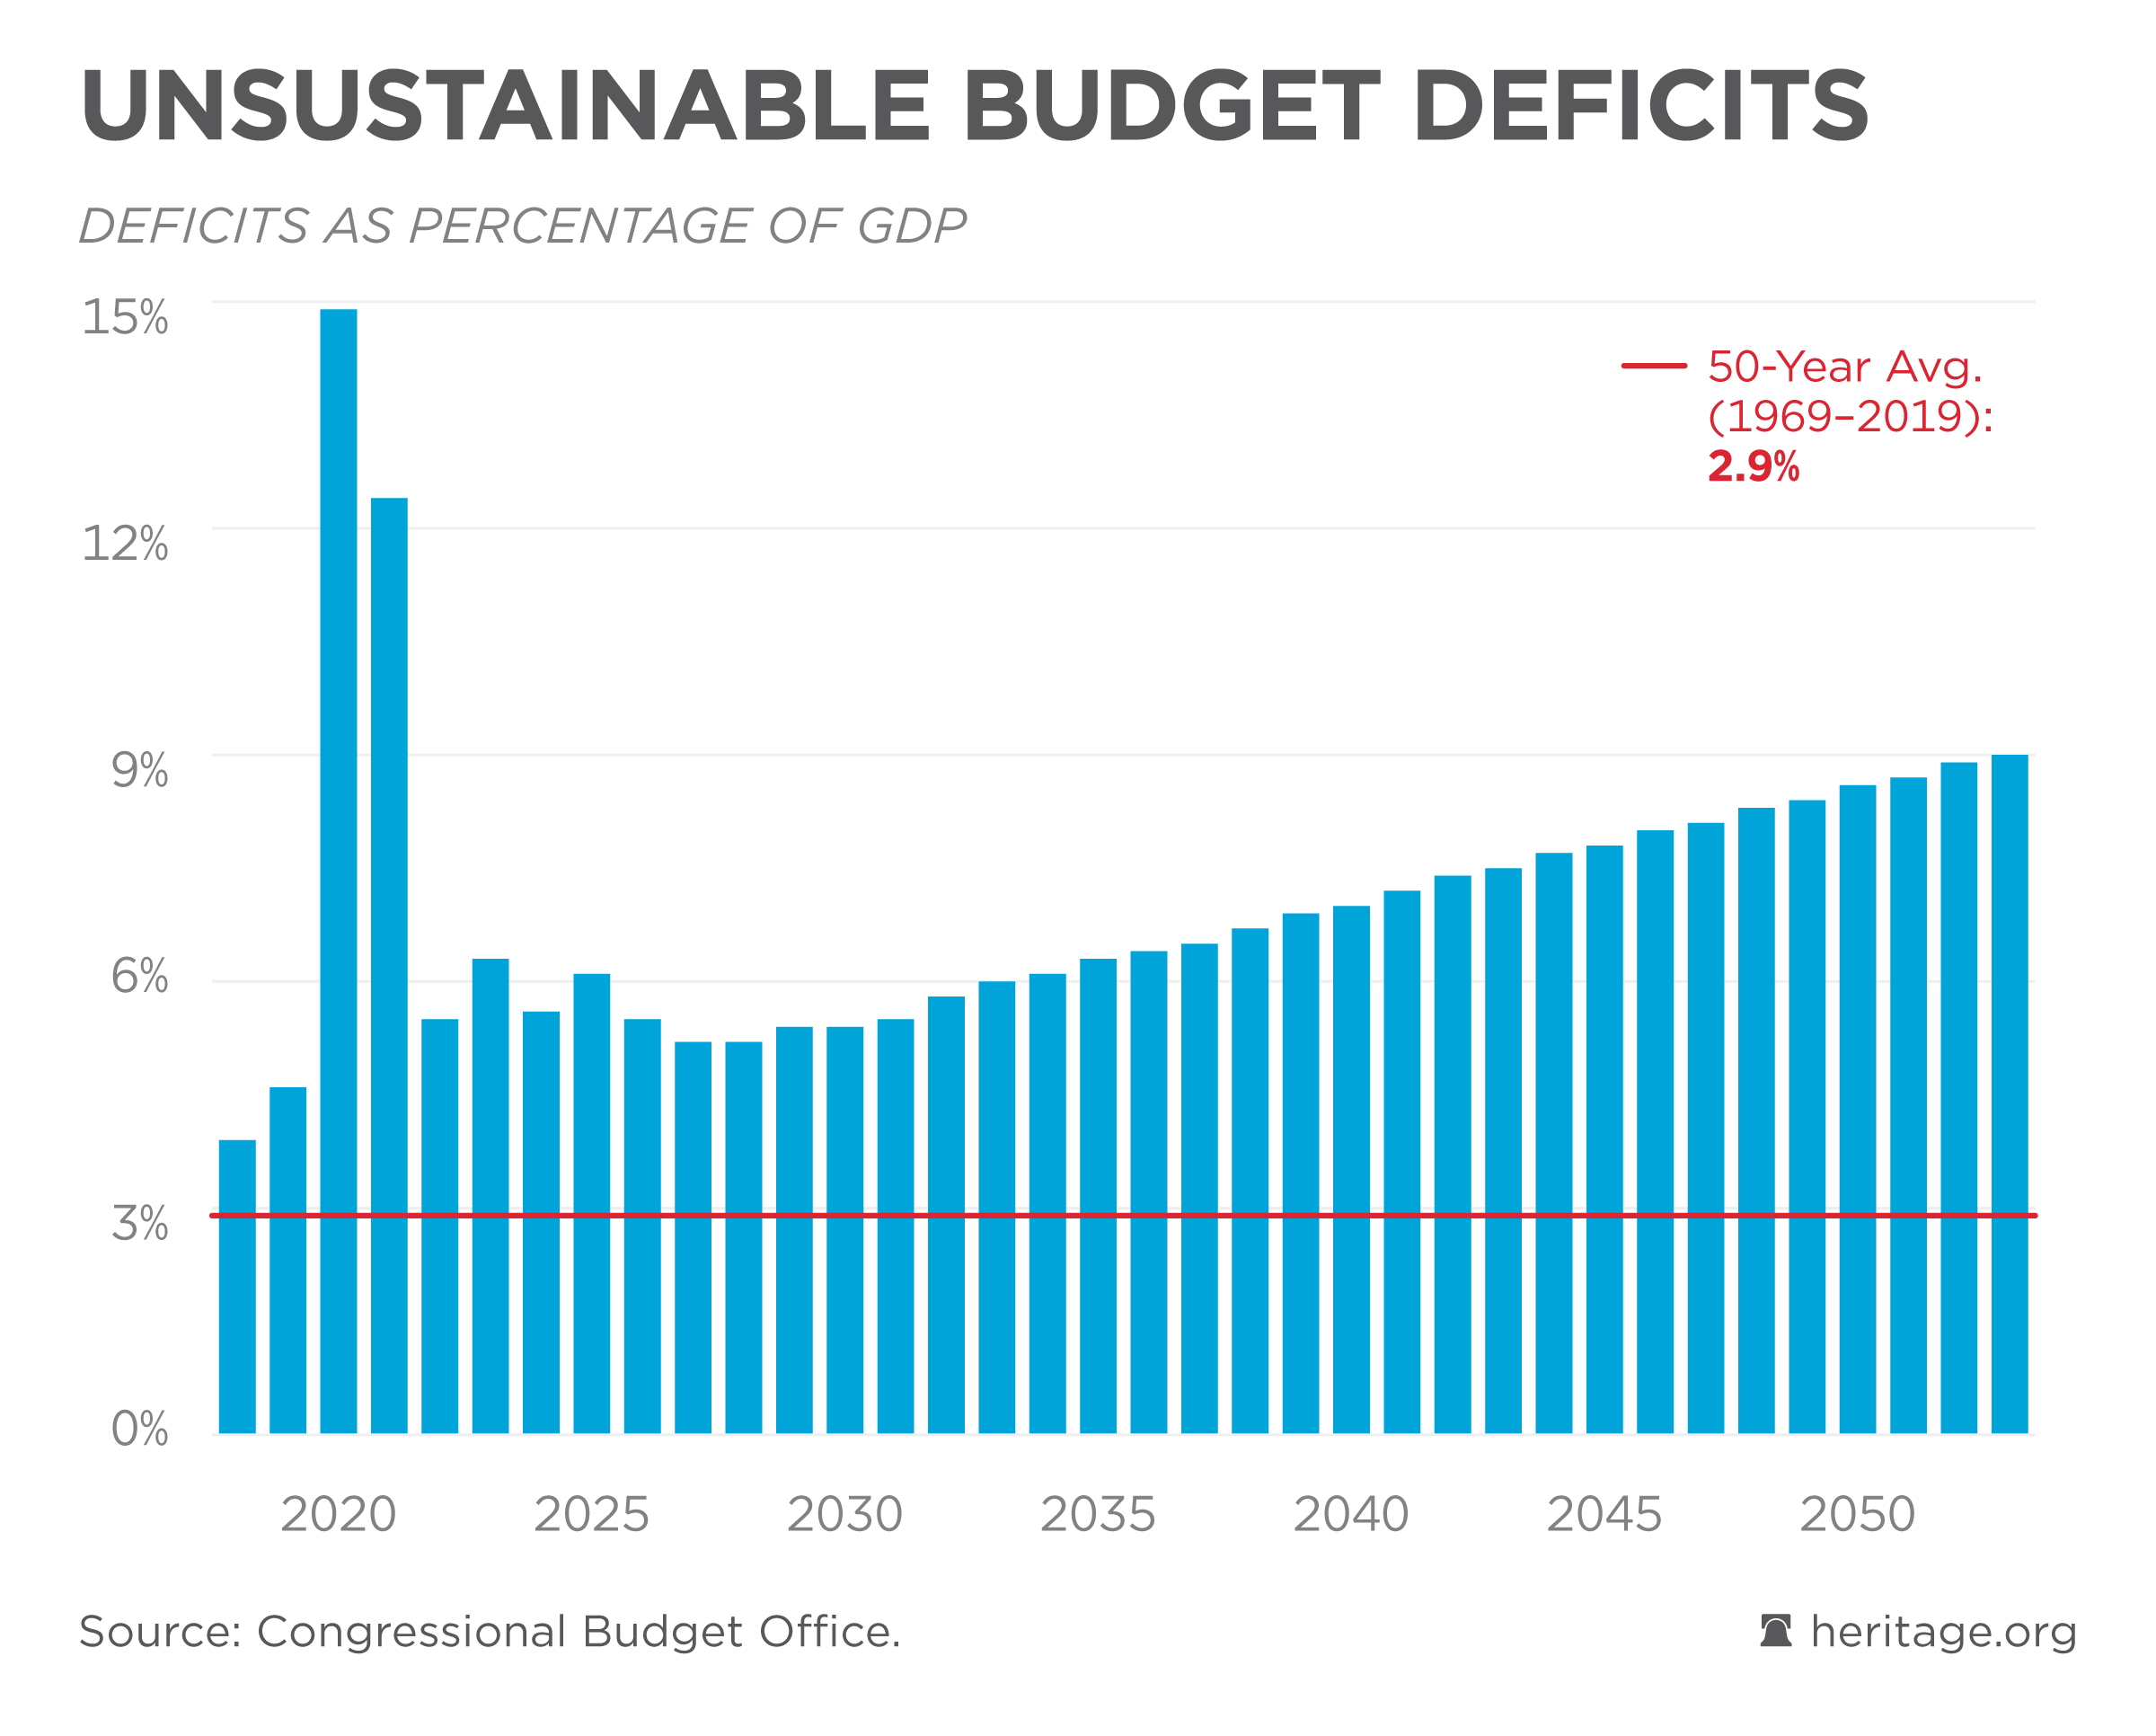
Excessive government spending, especially on autopilot (mandatory) programs, will continue to increase budget deficits if left unchecked. By 2054, the federal budget deficit is projected to be 9.1 percent of GDP. That is over three times the 50-year average, and would represent one-ninth of the economy. Lawmakers must cut spending and pursue structural budget reforms to control these deficits.
Updated February 8, 2024
Source: Congressional Budget Office
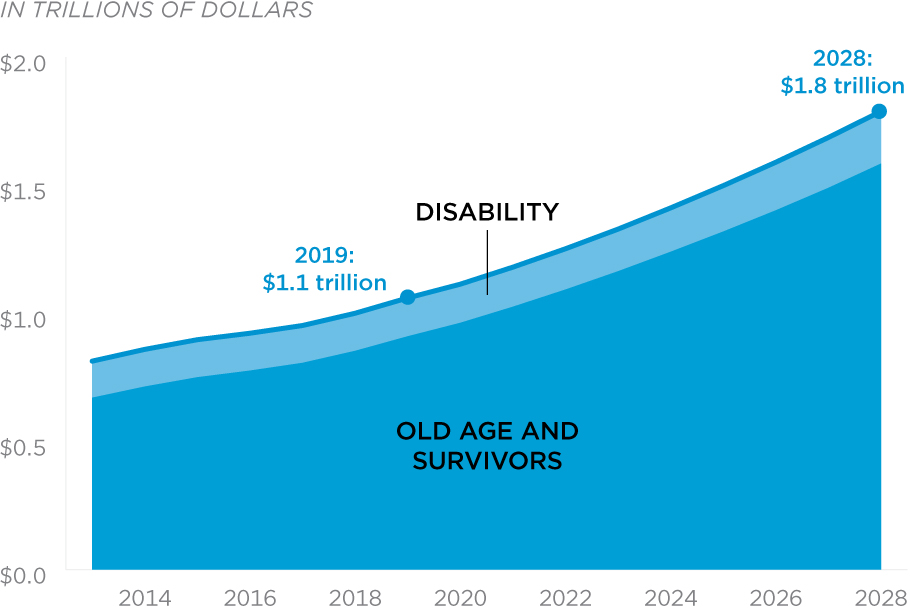
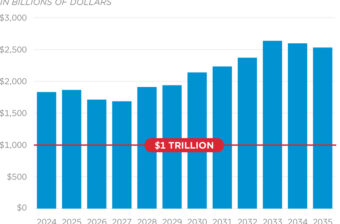
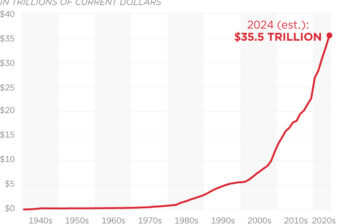
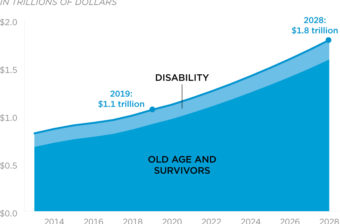
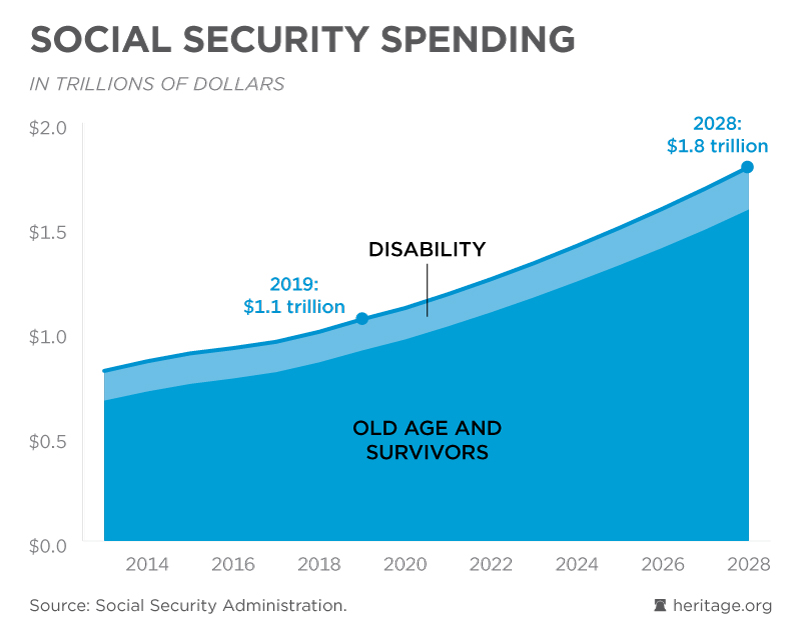
Spending on Social Security already exceeds $1 trillion annually, as spending on both Disability Insurance (DI) and Old-Age and Survivors Insurance benefits (OASI) continues growing.
Source: Social Security Administration
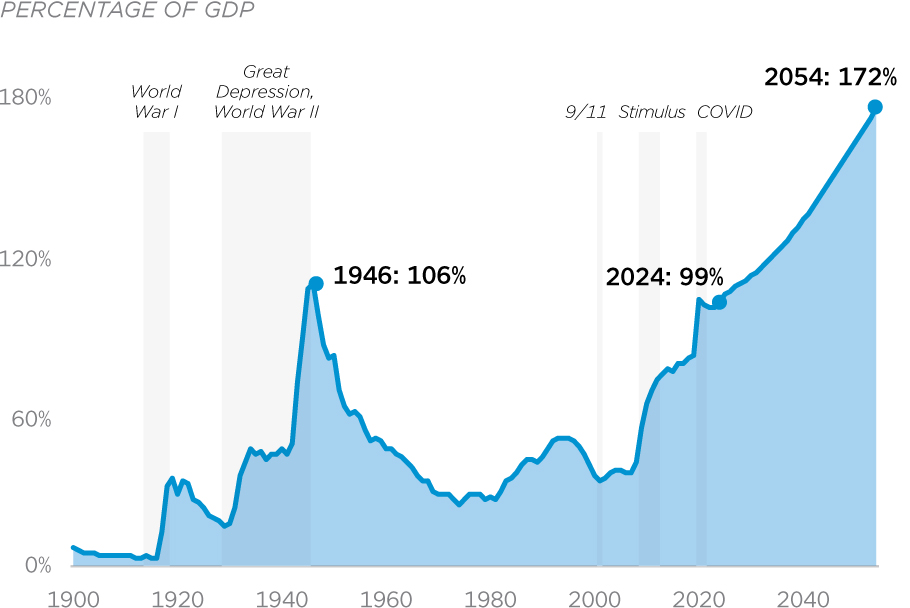
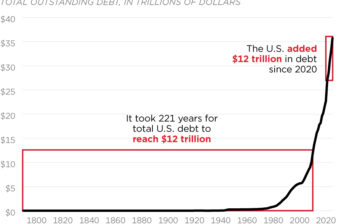
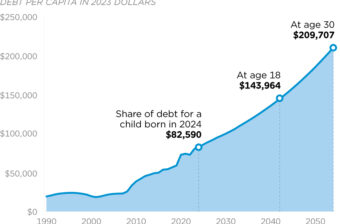
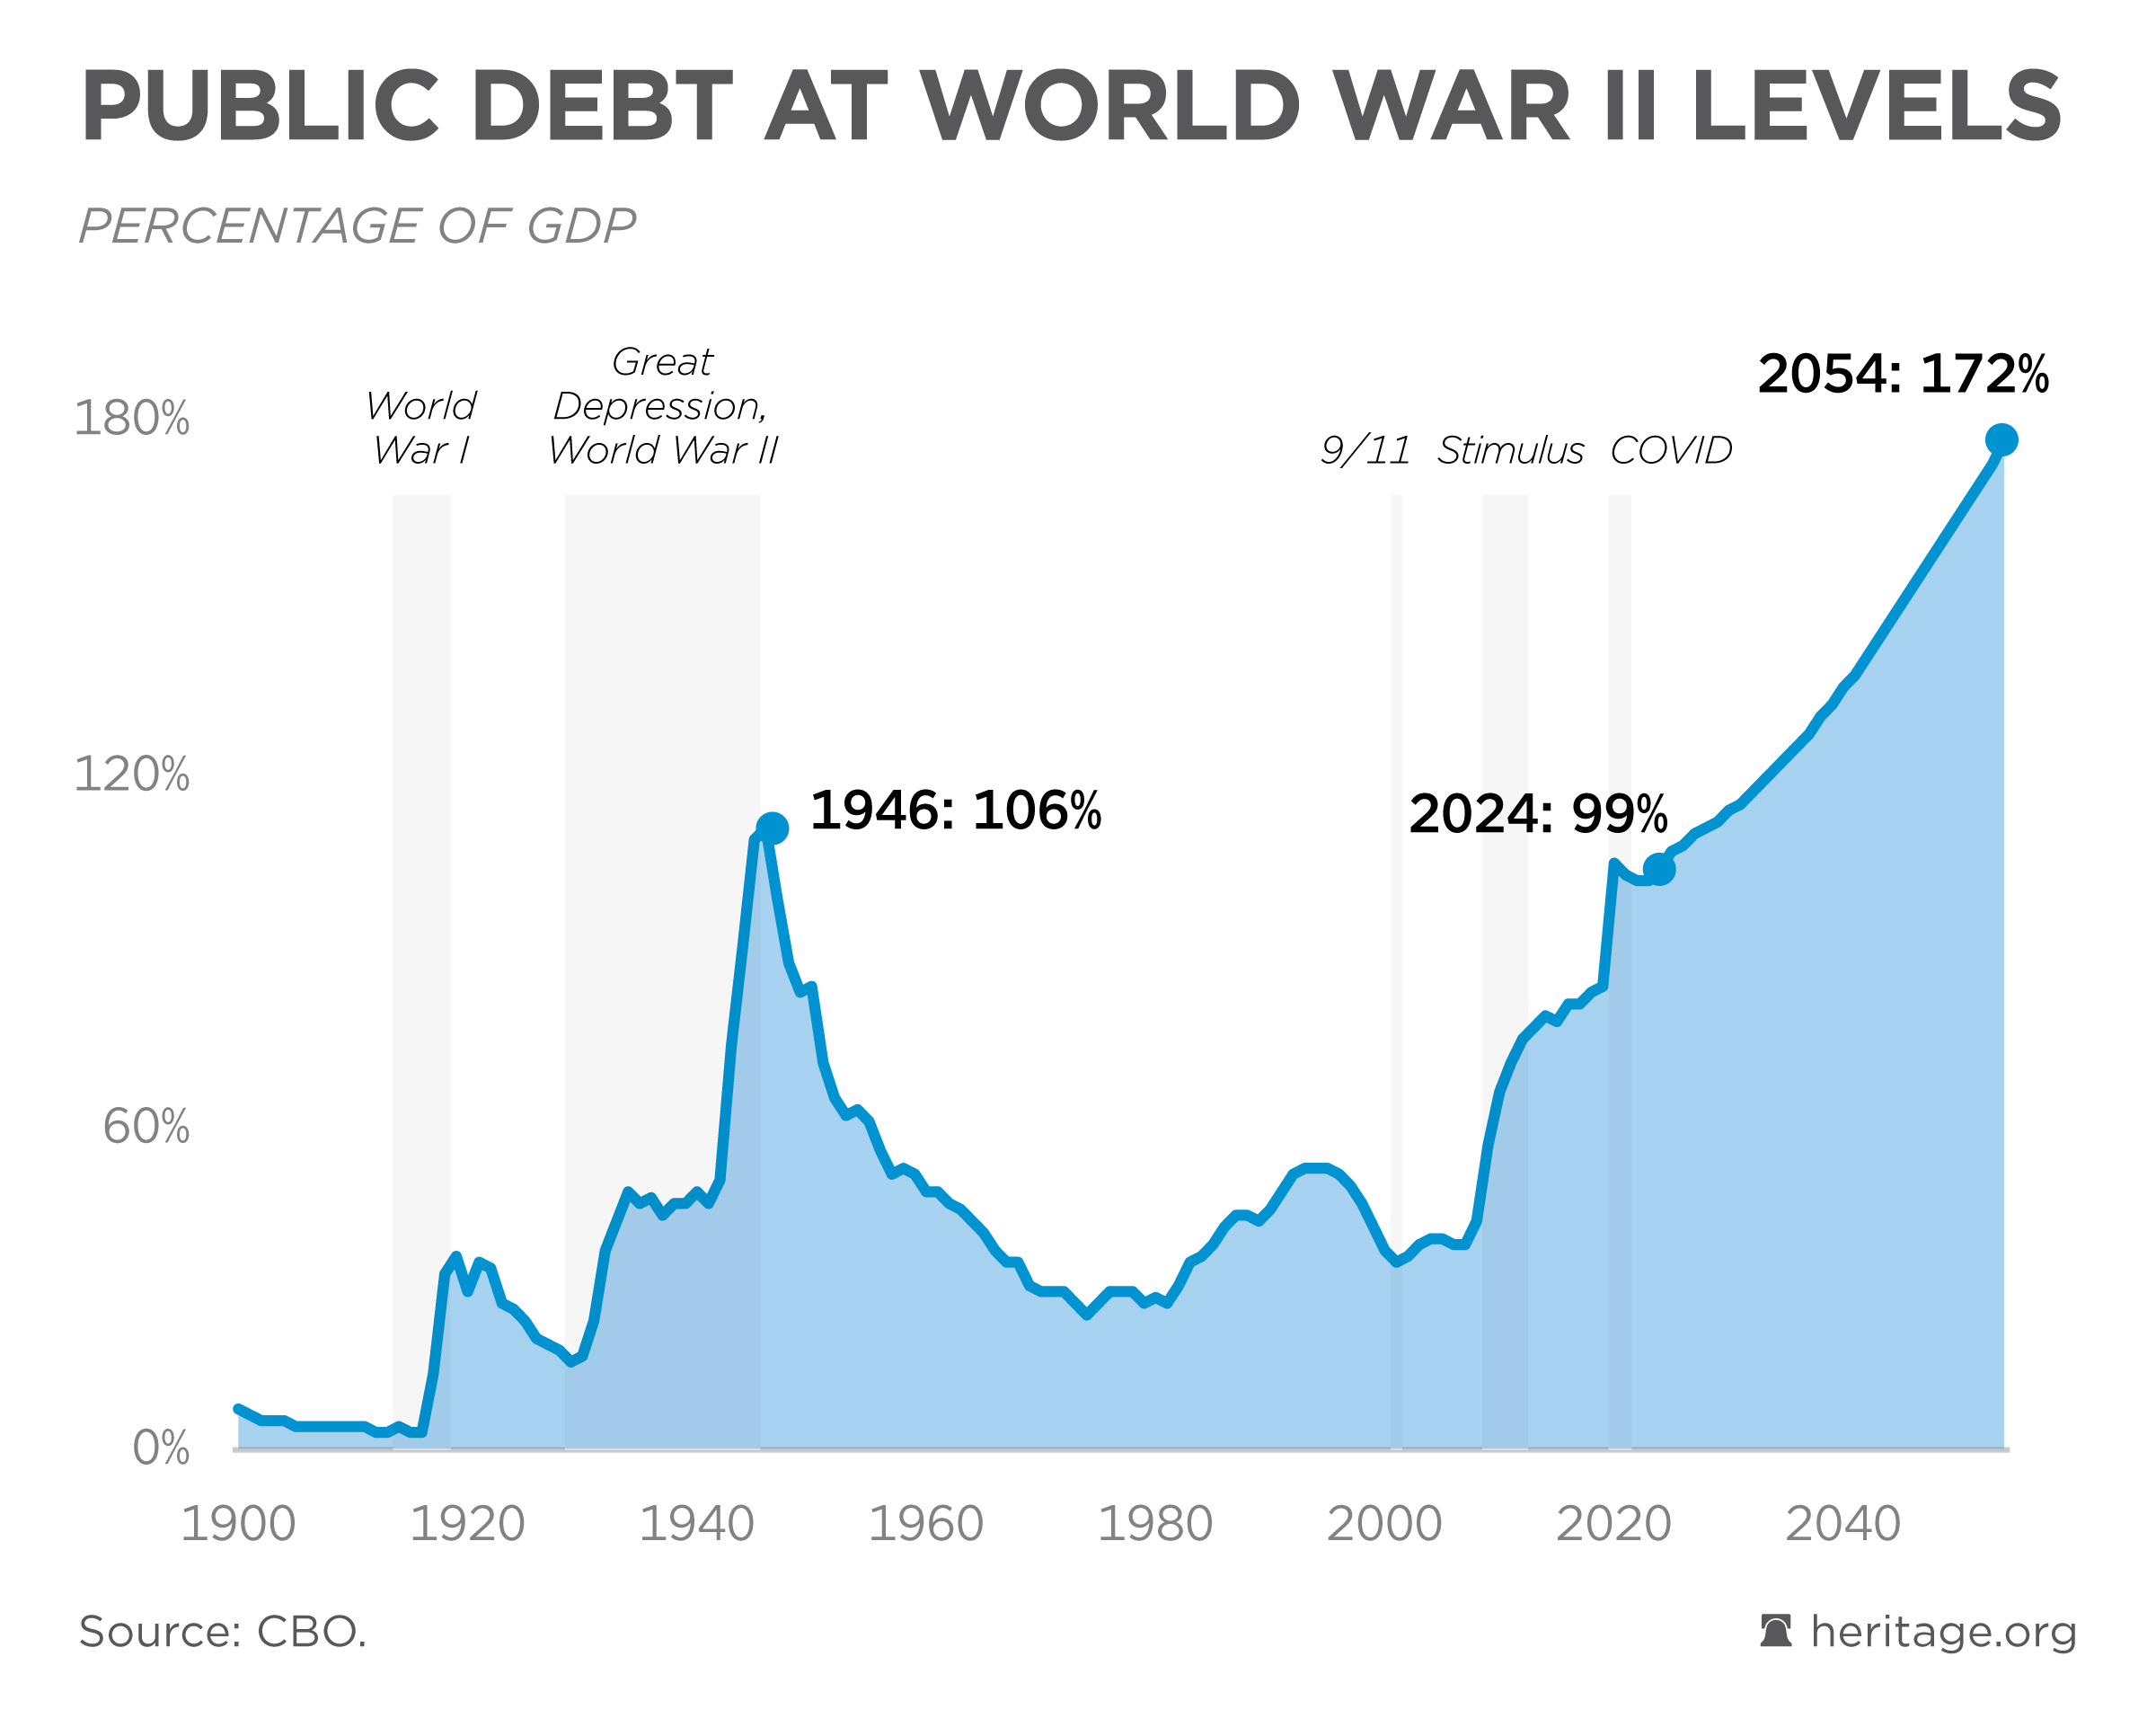
Due to unchecked federal spending, publicly held federal debt is at its highest level since World War II.
Updated February 8, 2024
Source: Congressional Budget Office
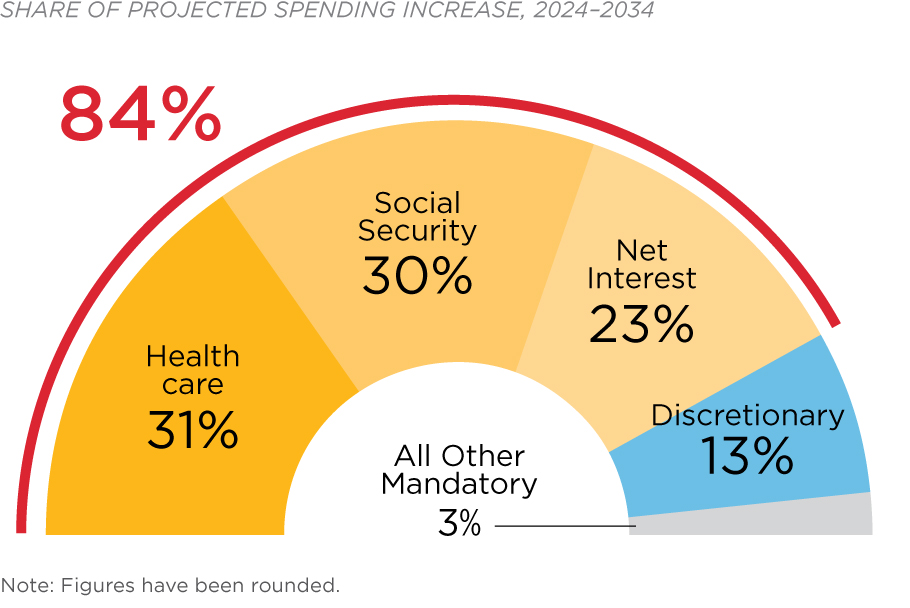
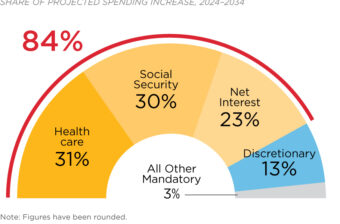
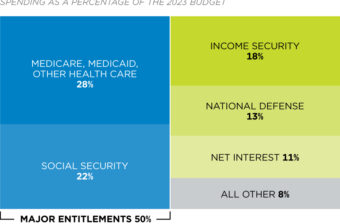
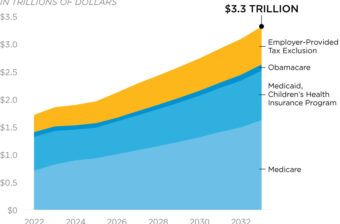
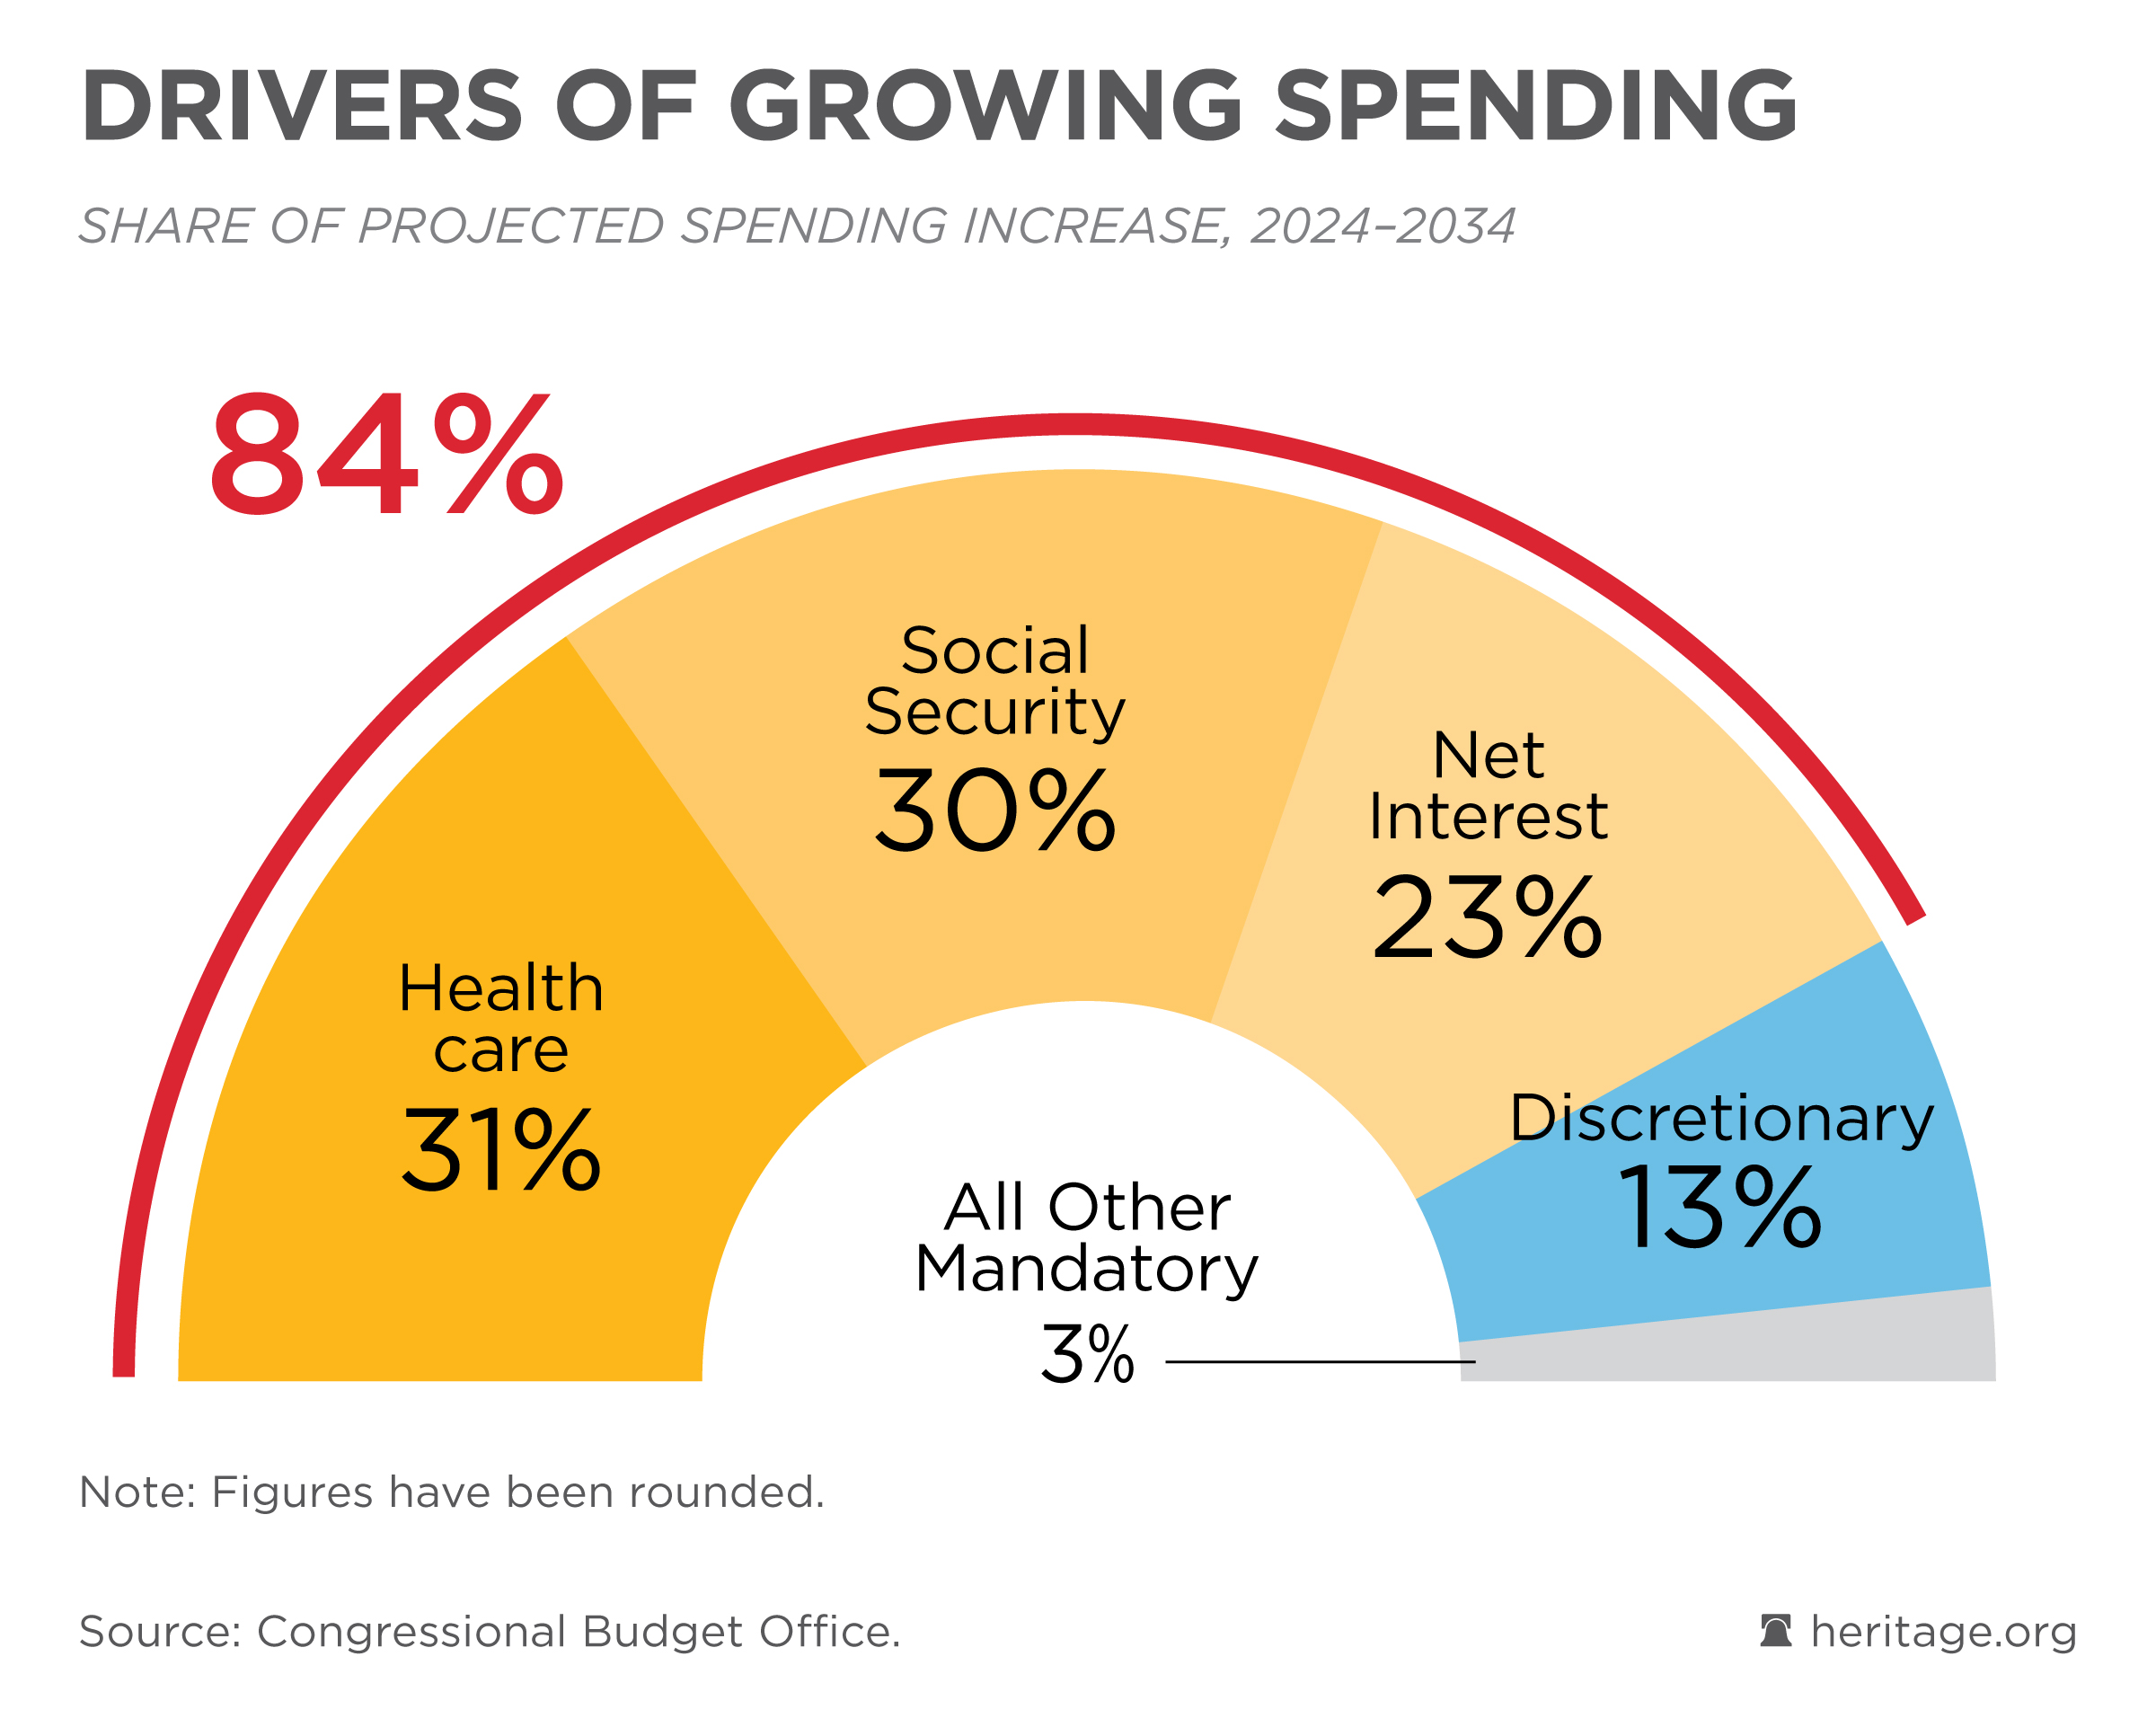
Federal spending will increase by more than $3.5 trillion from 2025 through 2035. Three major budget categories—health care, social security, and interest on the debt—will account for 84 percent of this spending growth.
Updated January 27, 2025
Source: Congressional Budget Office
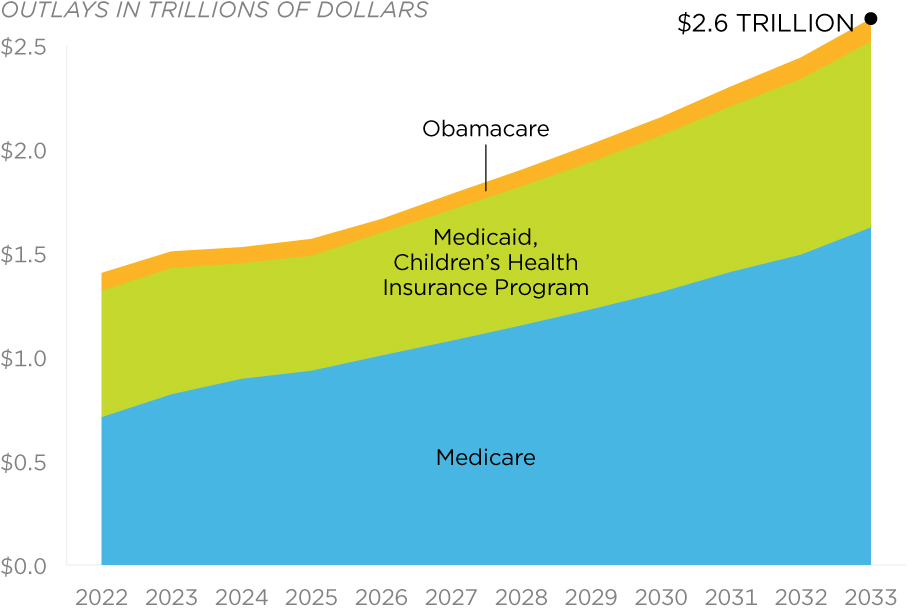
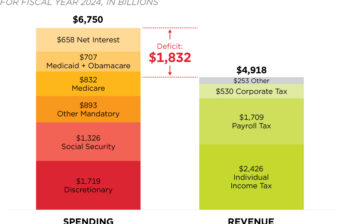
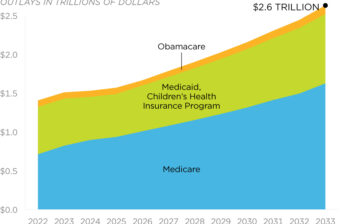
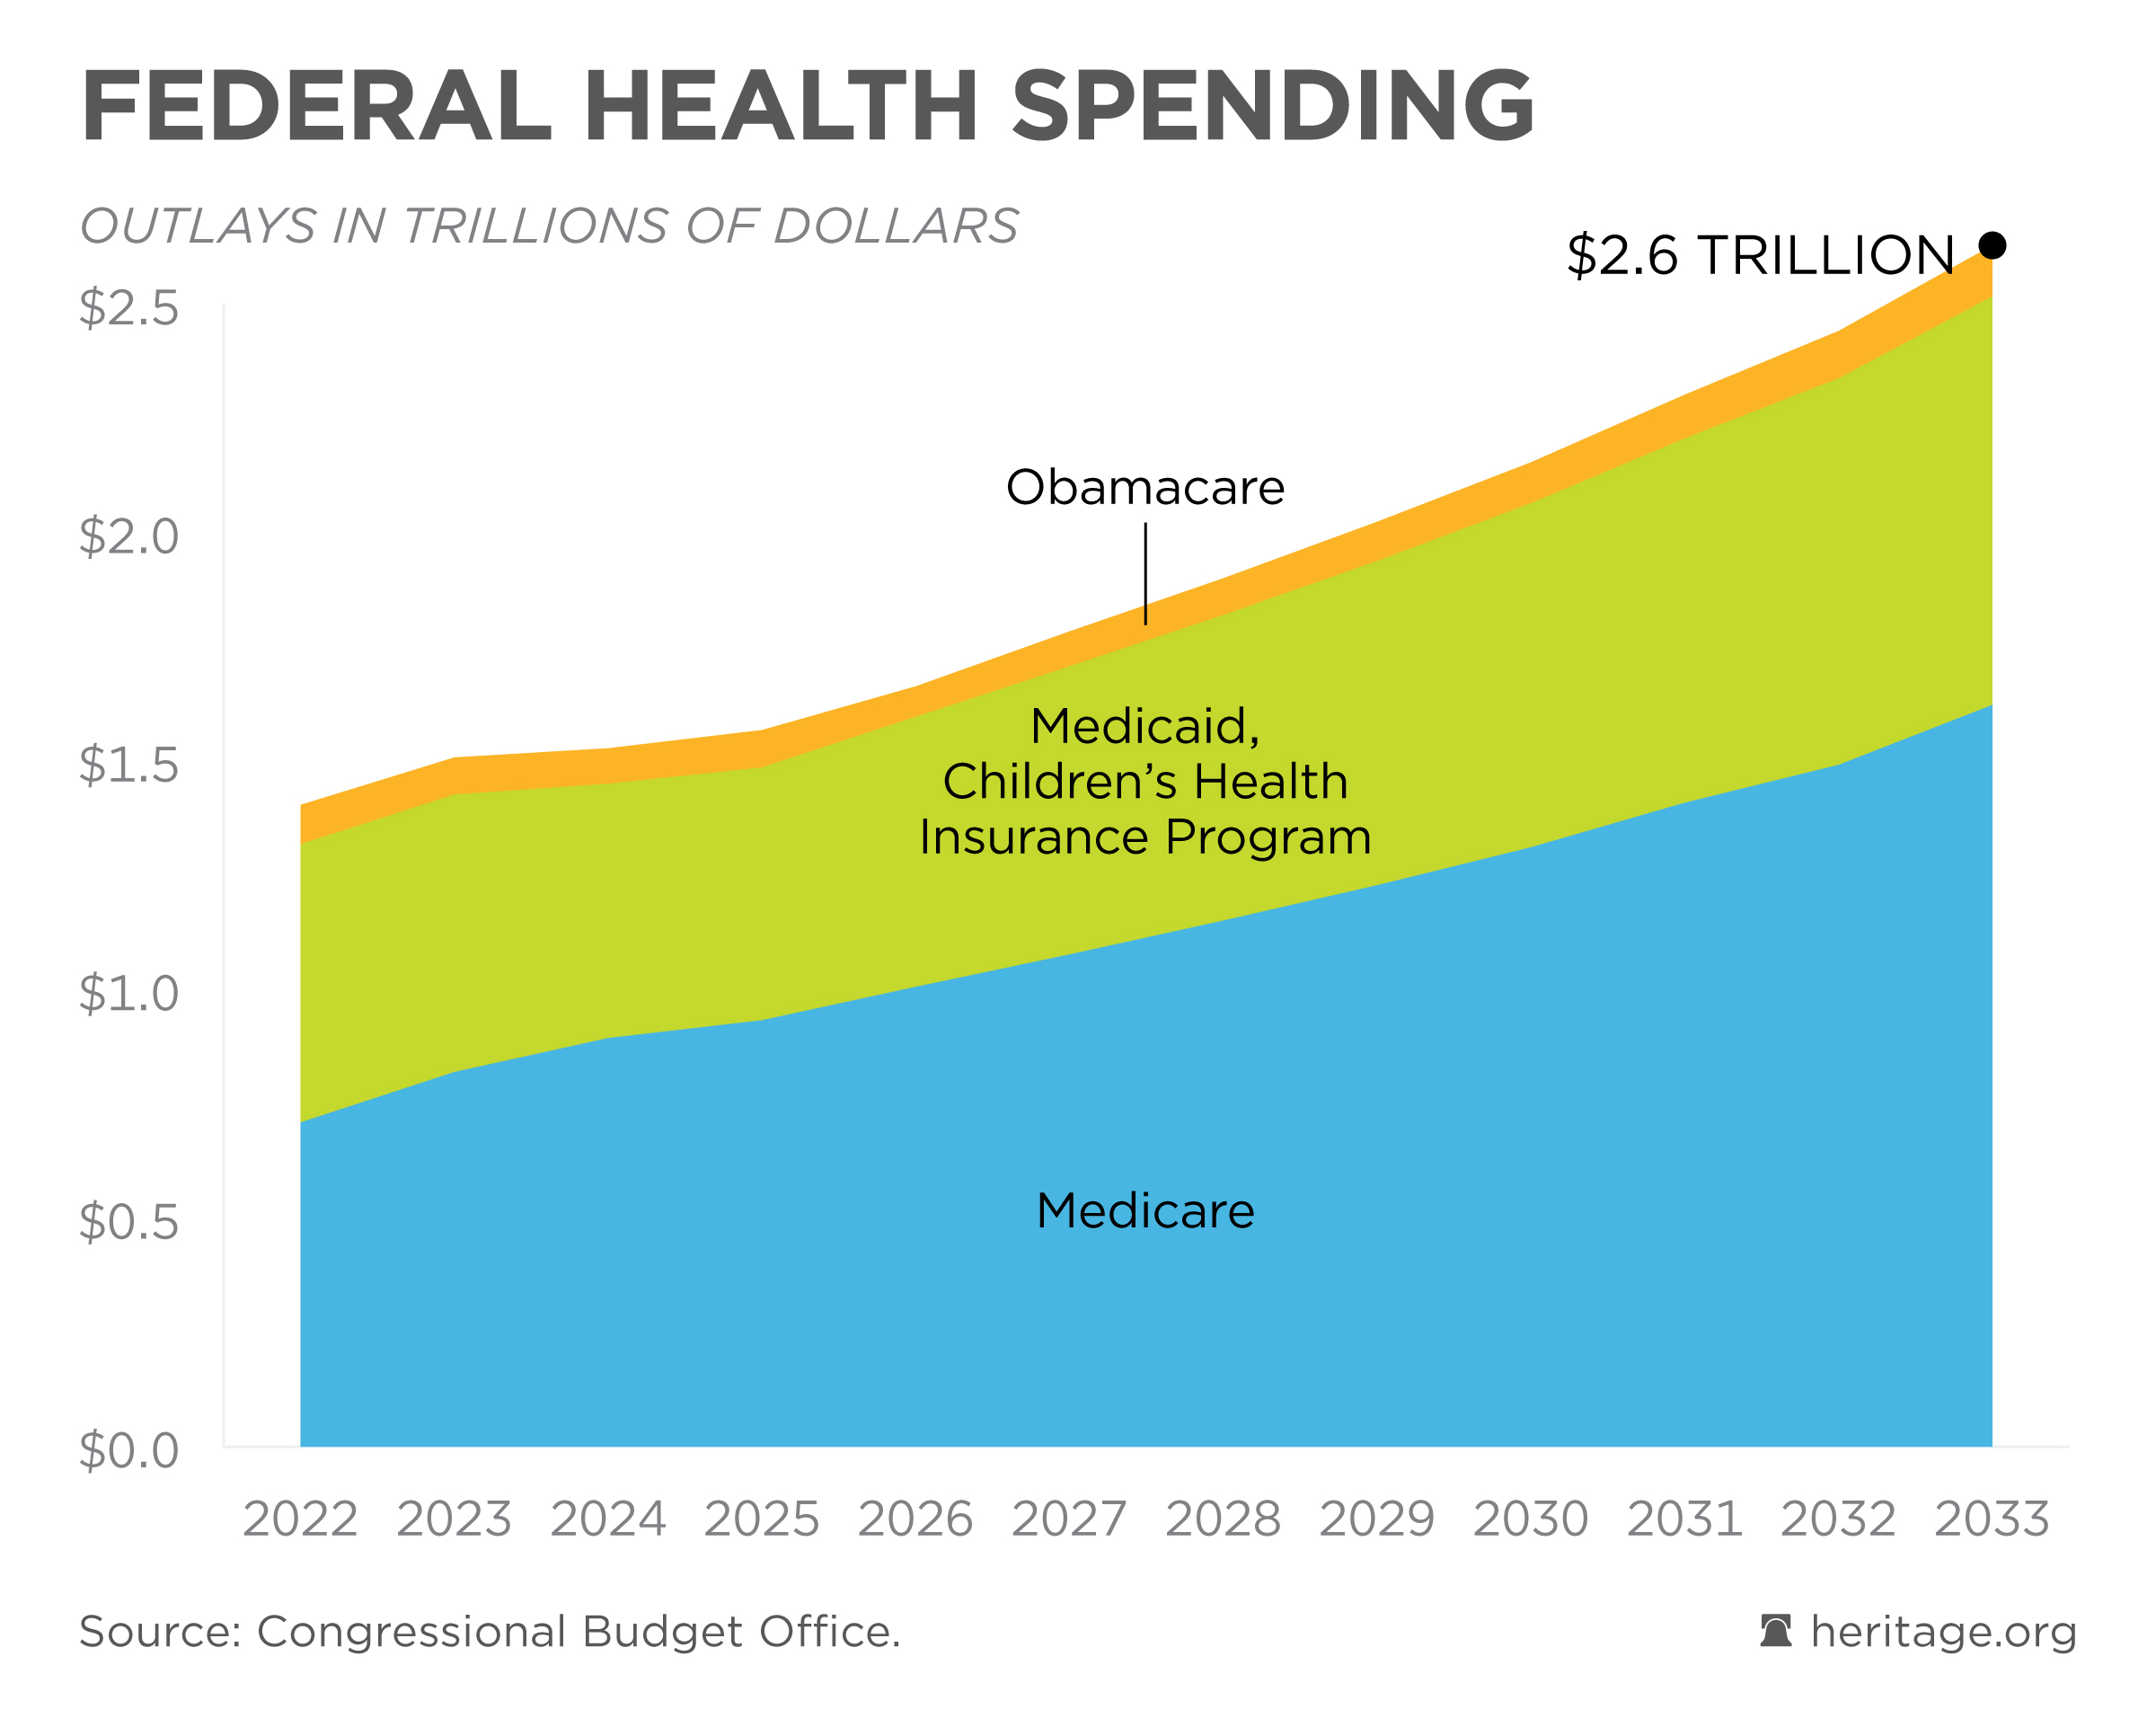
Health care spending already consumes more of the federal budget than any other area.
Updated March 9, 2023
Source: Congressional Budget Office
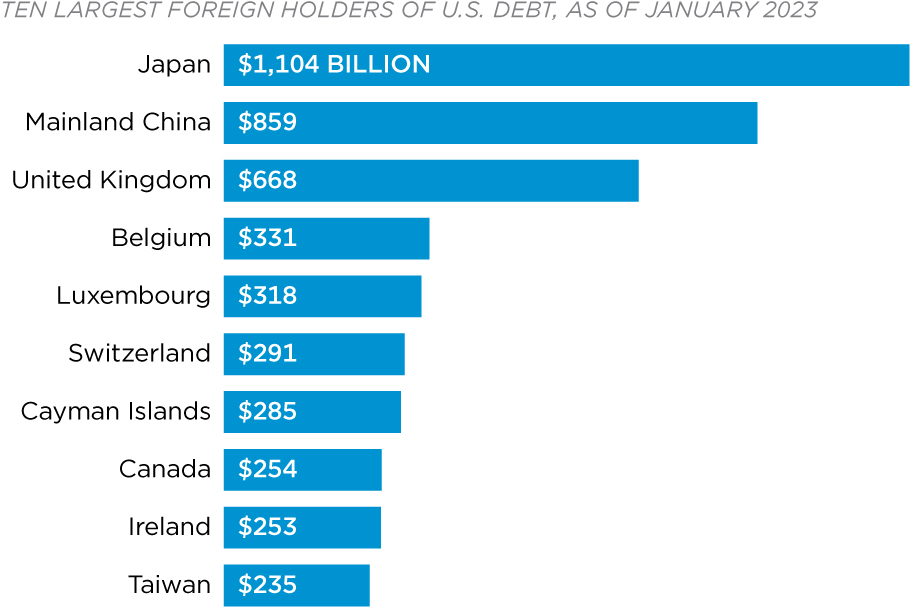
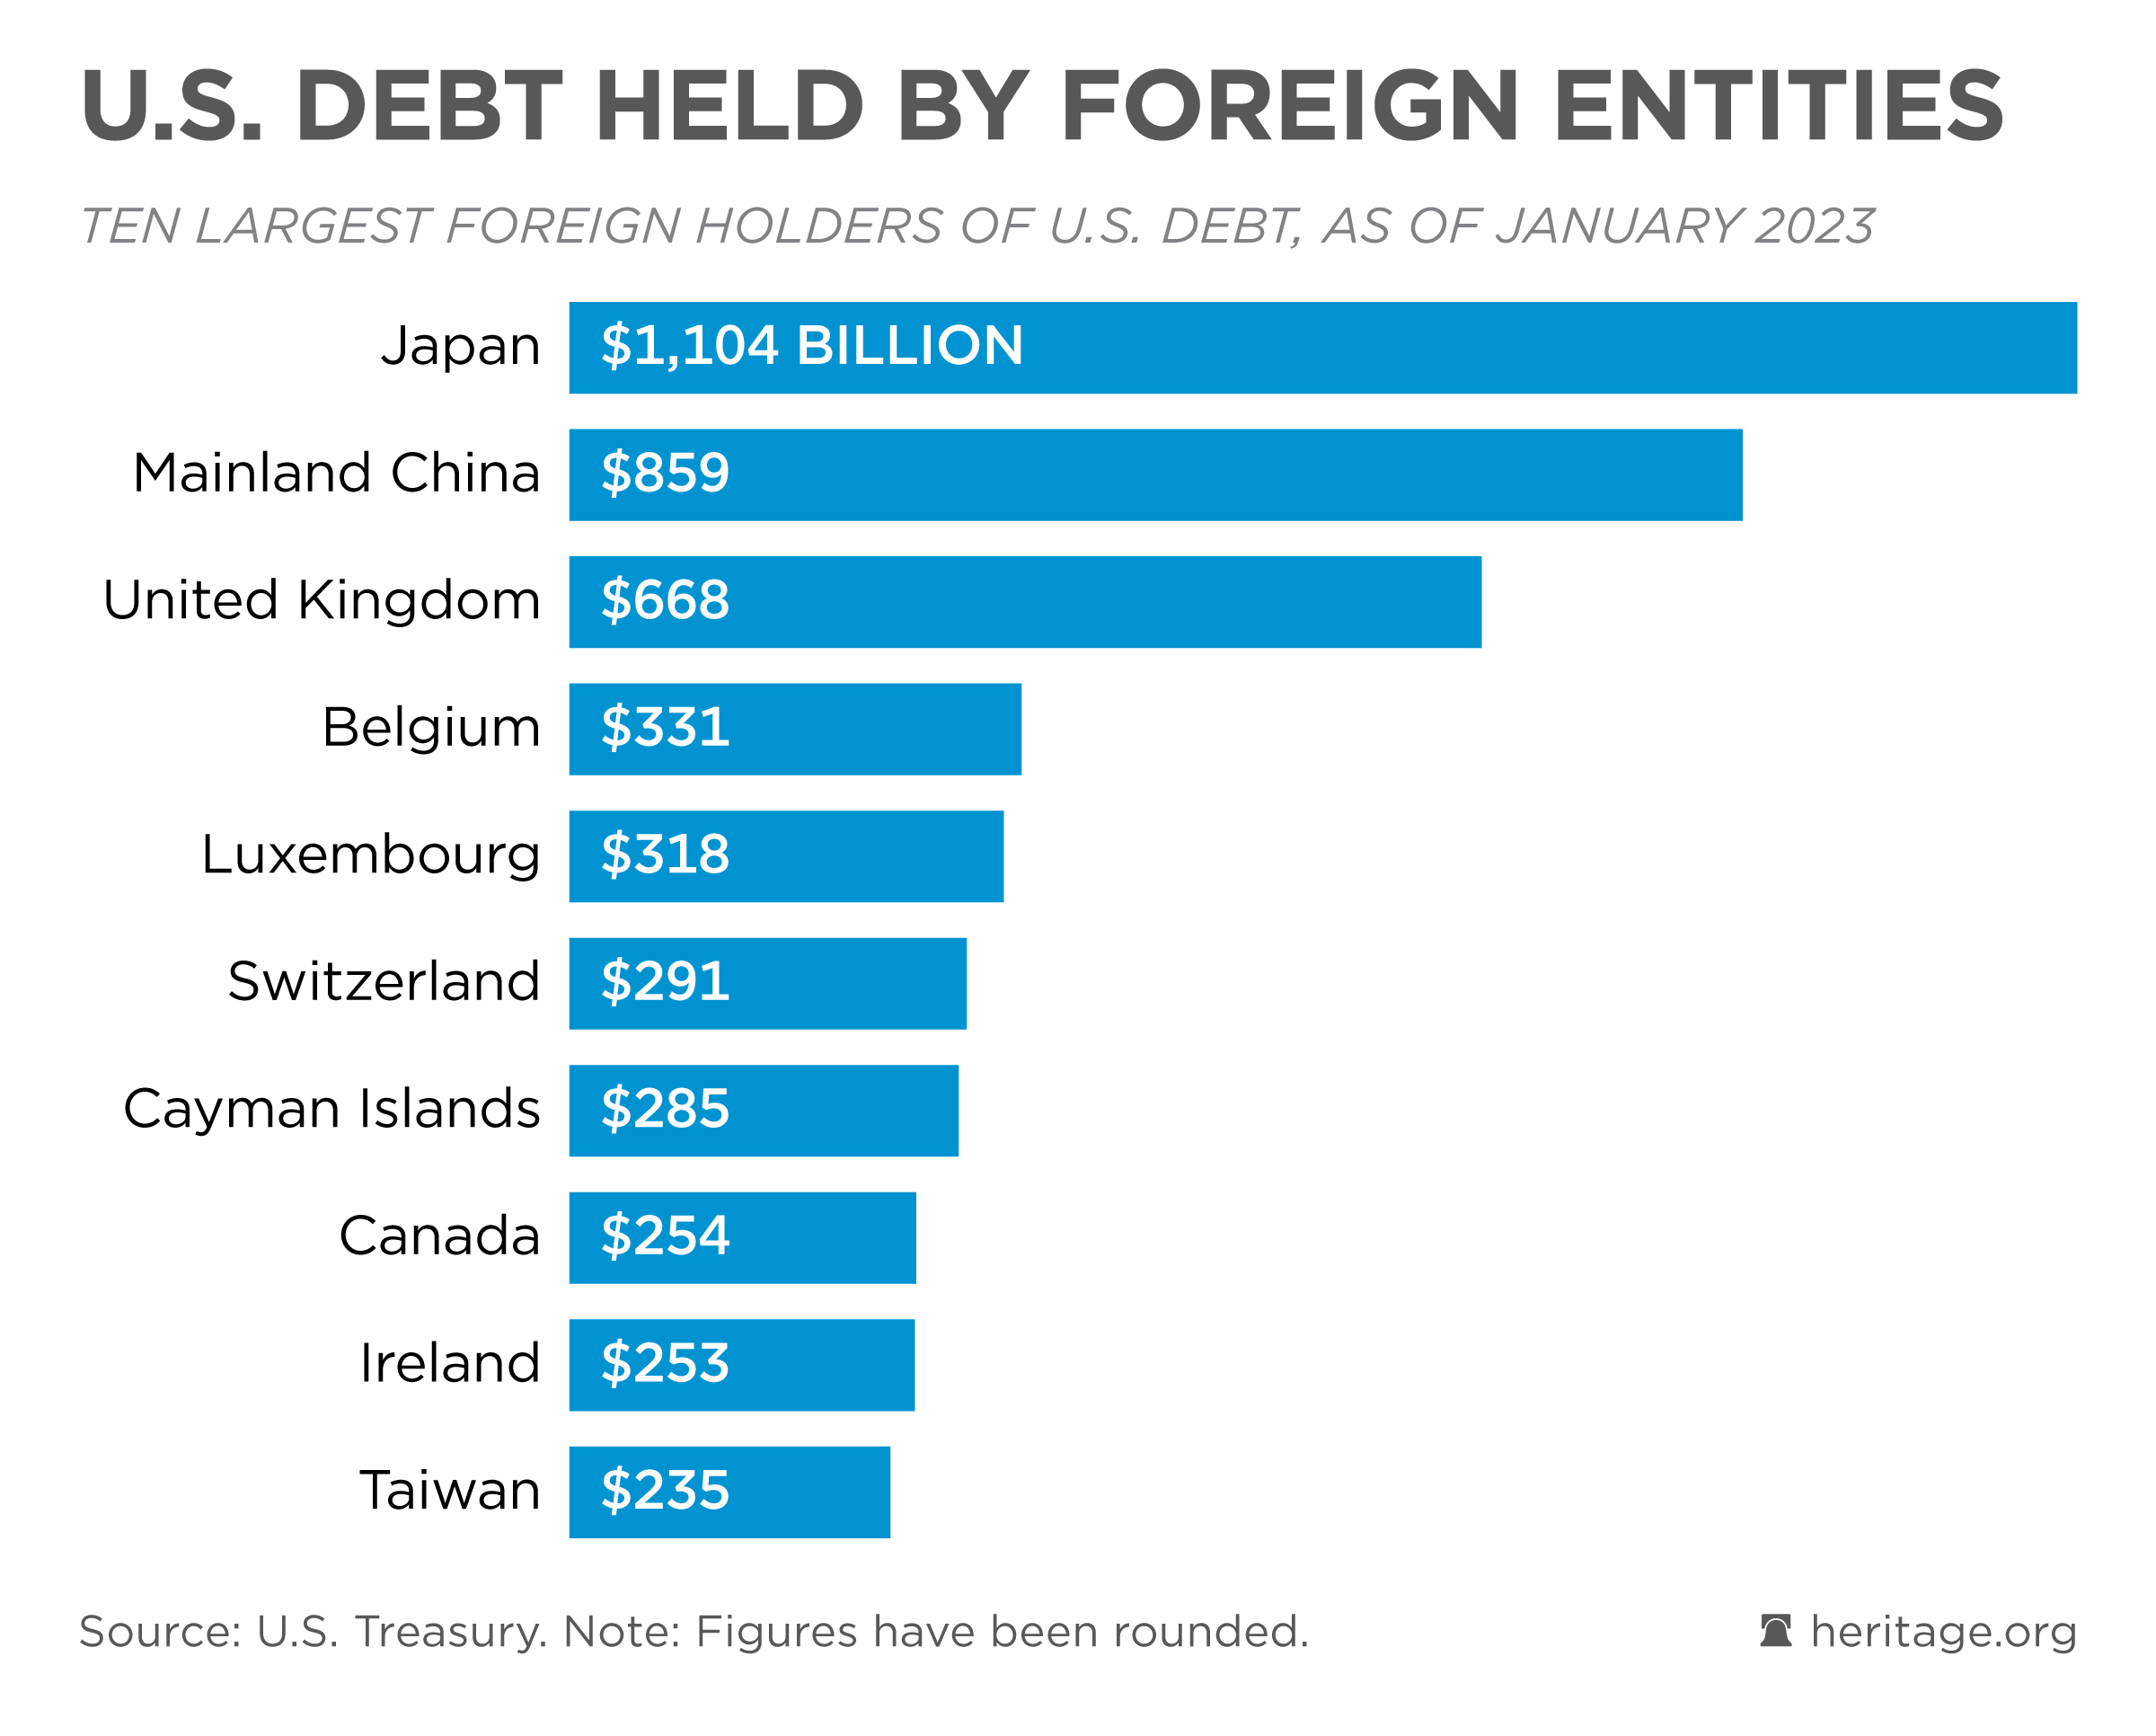
To finance borrowing, the U.S. government sells treasury securities domestically and abroad. Foreign governments, individuals, and institutions then buy these securities as an investment. Currently, mainland China is the second-largest foreign owner of U.S. national debt with $859 billion.
Updated August 31, 2023
Source: U.S. Treasury Department
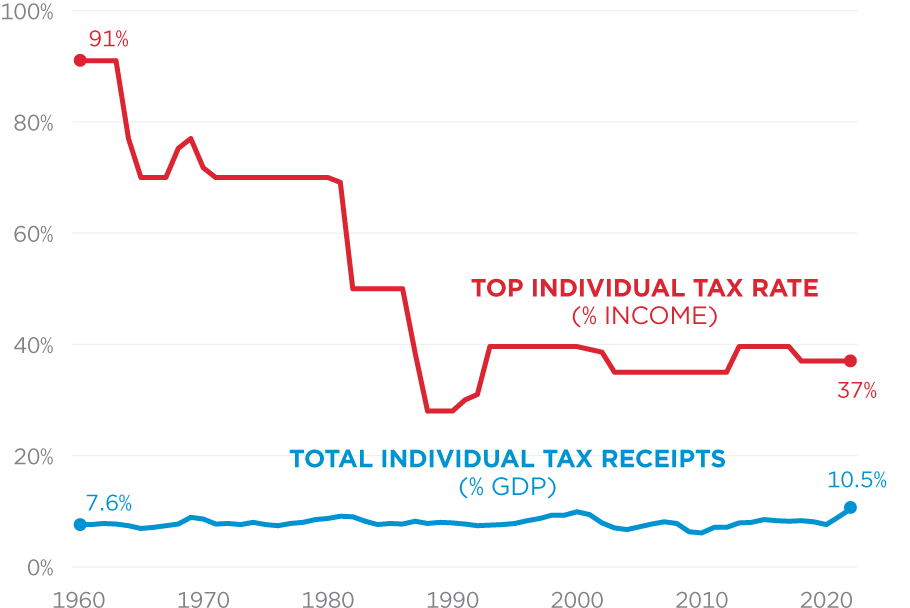
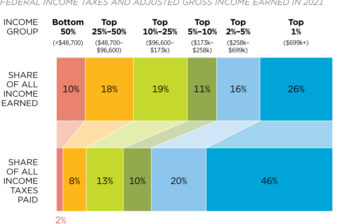
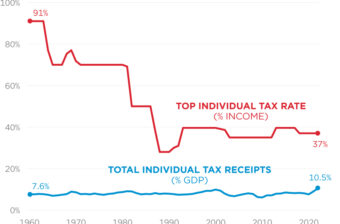
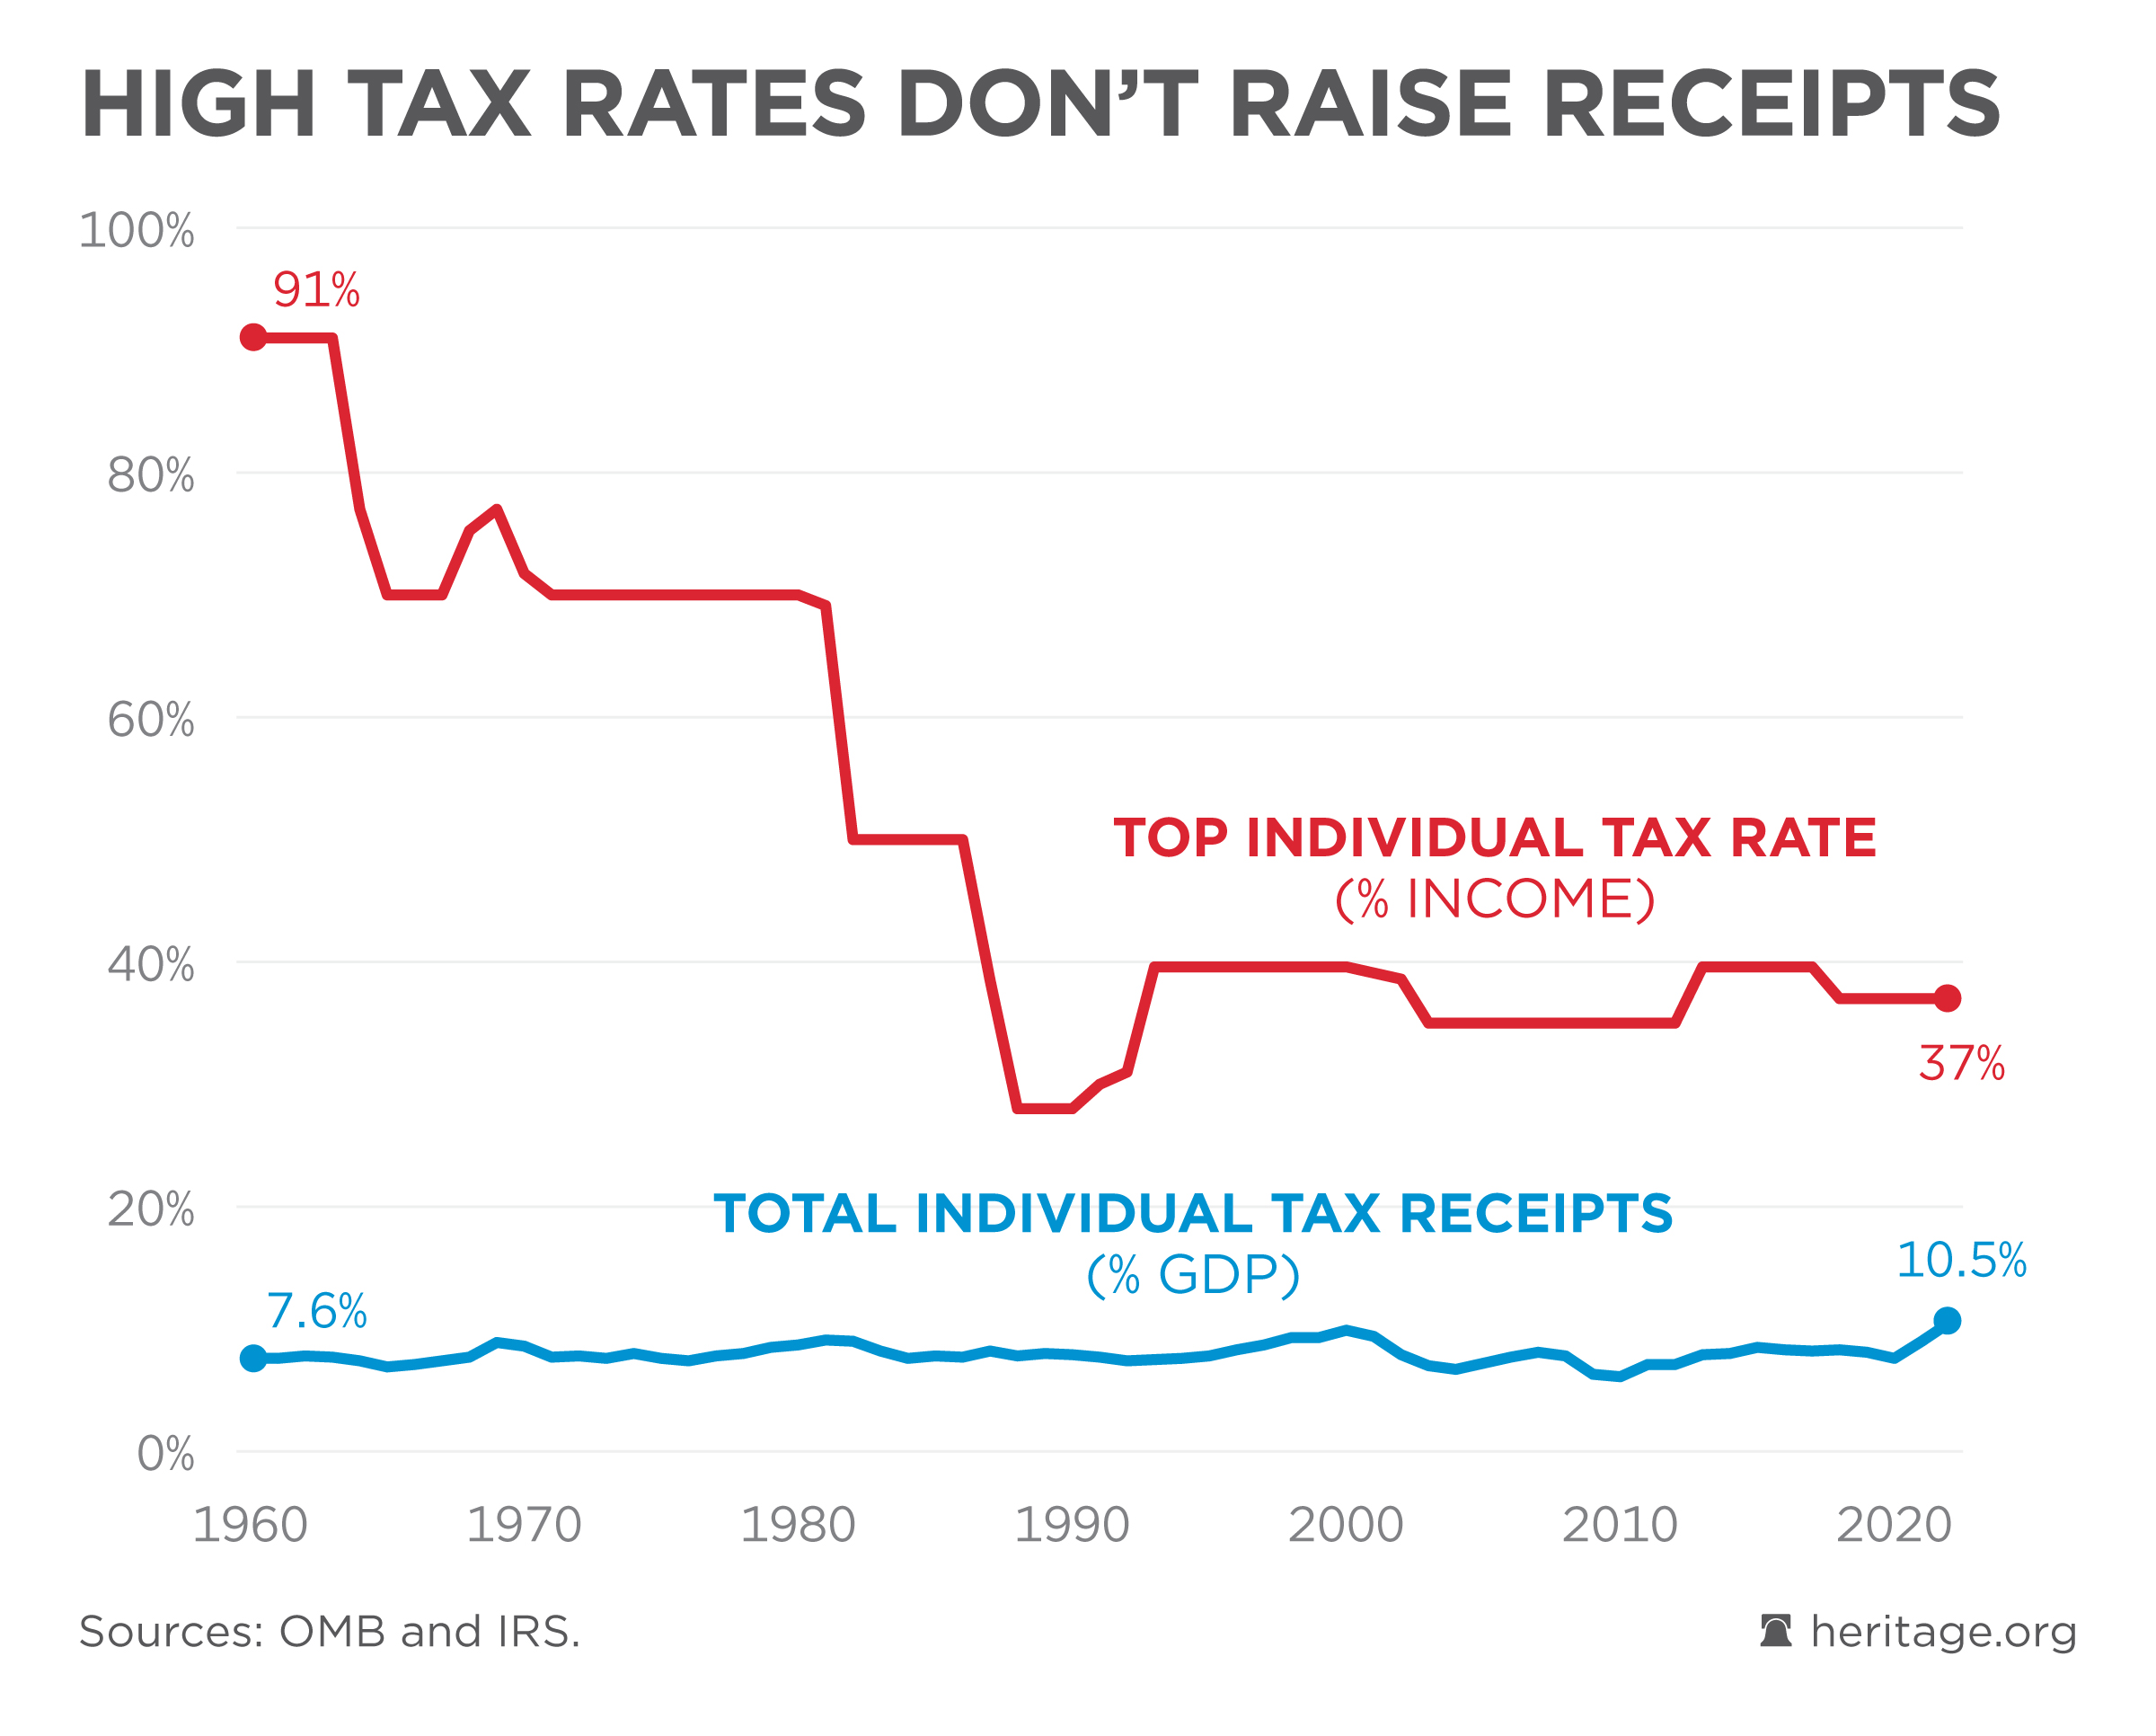
Despite the top individual tax rate fluctuating between 91 and 28 percent over the past 50 years, total individual tax receipts have remained fairly stable. The top rate decreased in 2018 and is now at 37 percent.
Additional Sources: Internal Revenue Service
Updated May 16, 2023
Source: Office of Management and Budget


