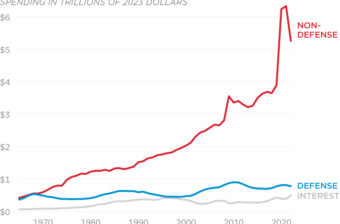
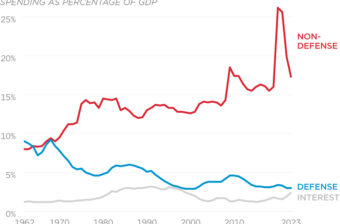
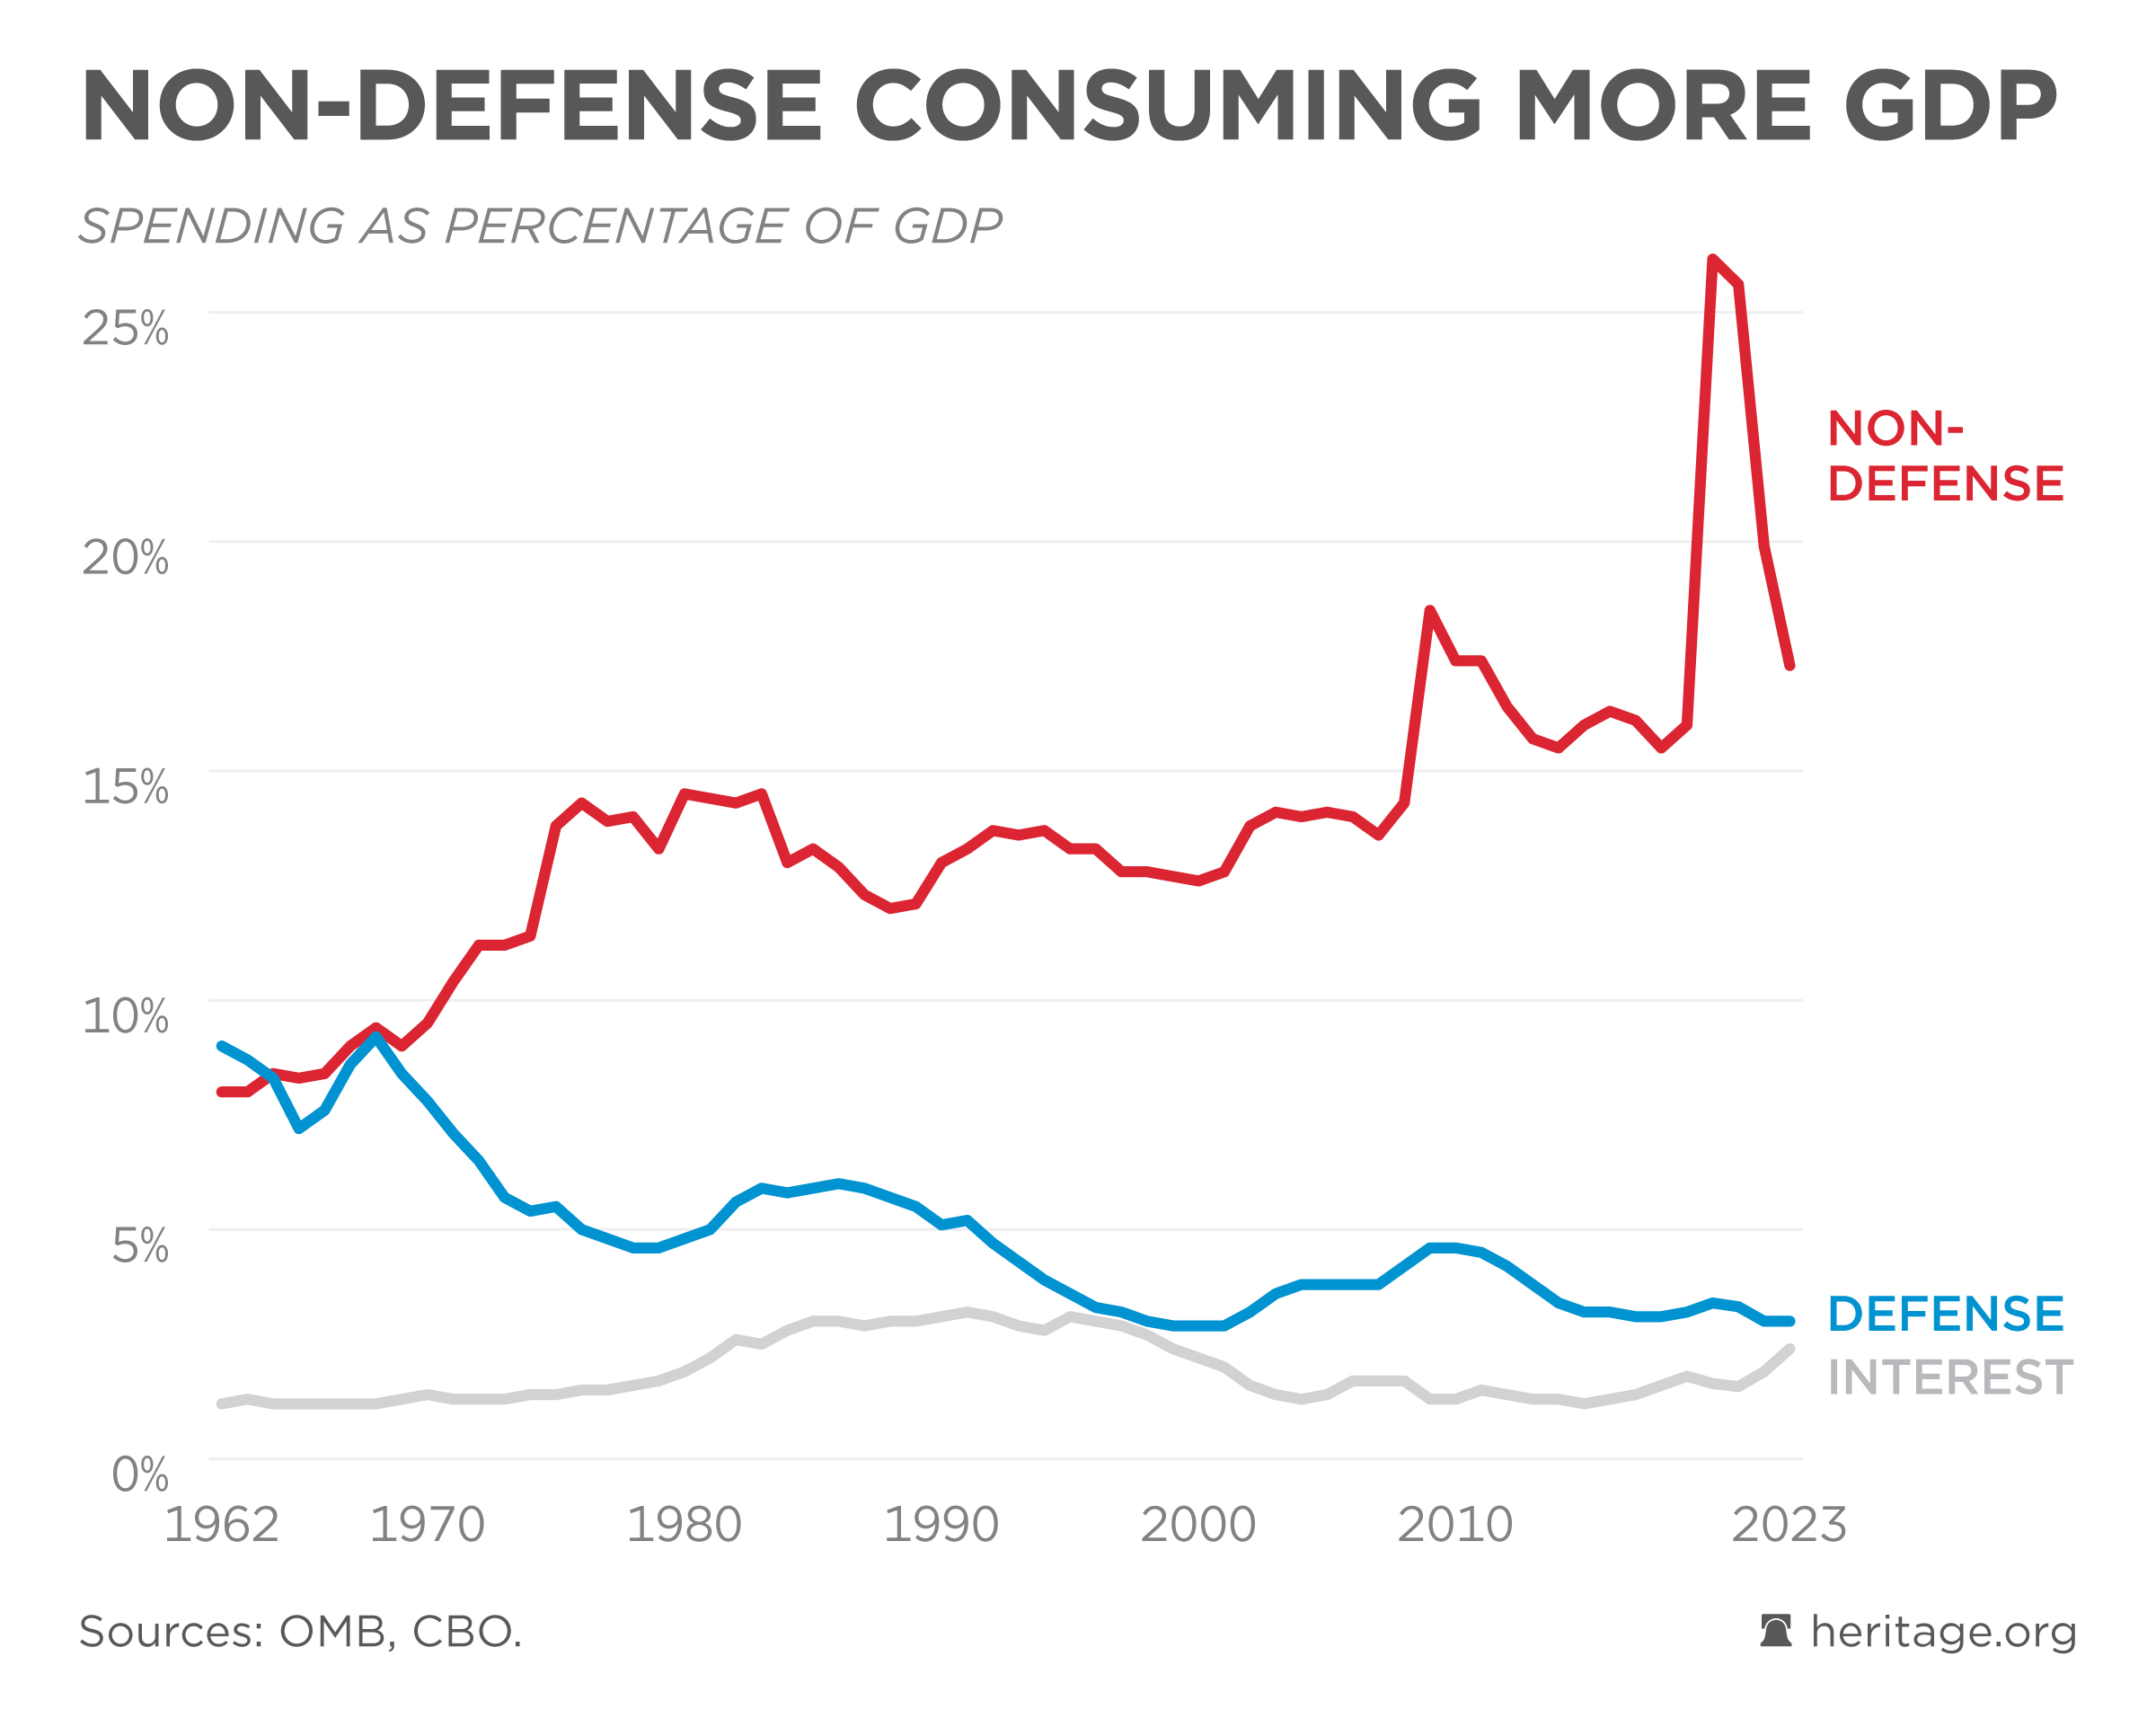
Non-Defense Consuming More GDP
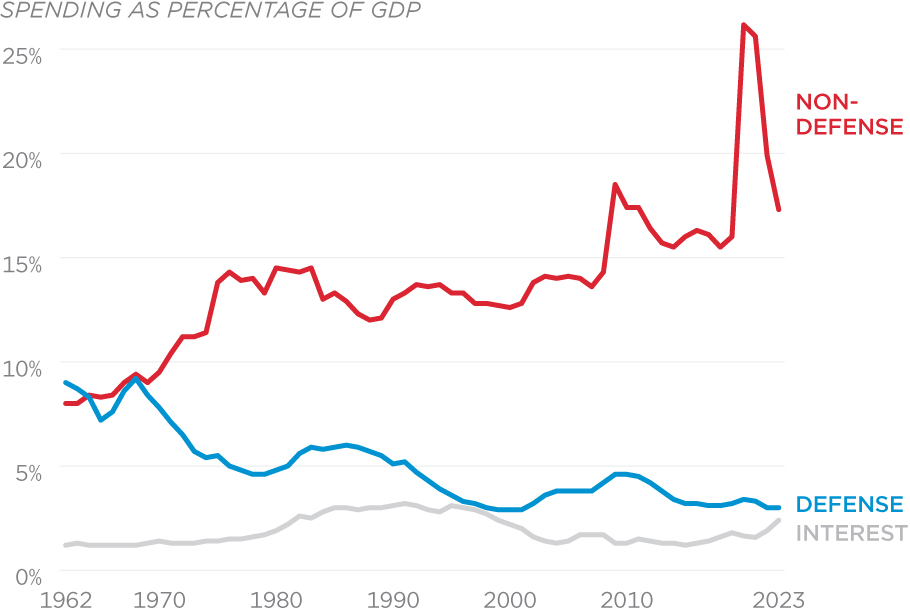
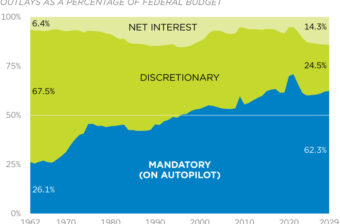
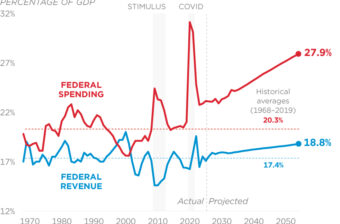
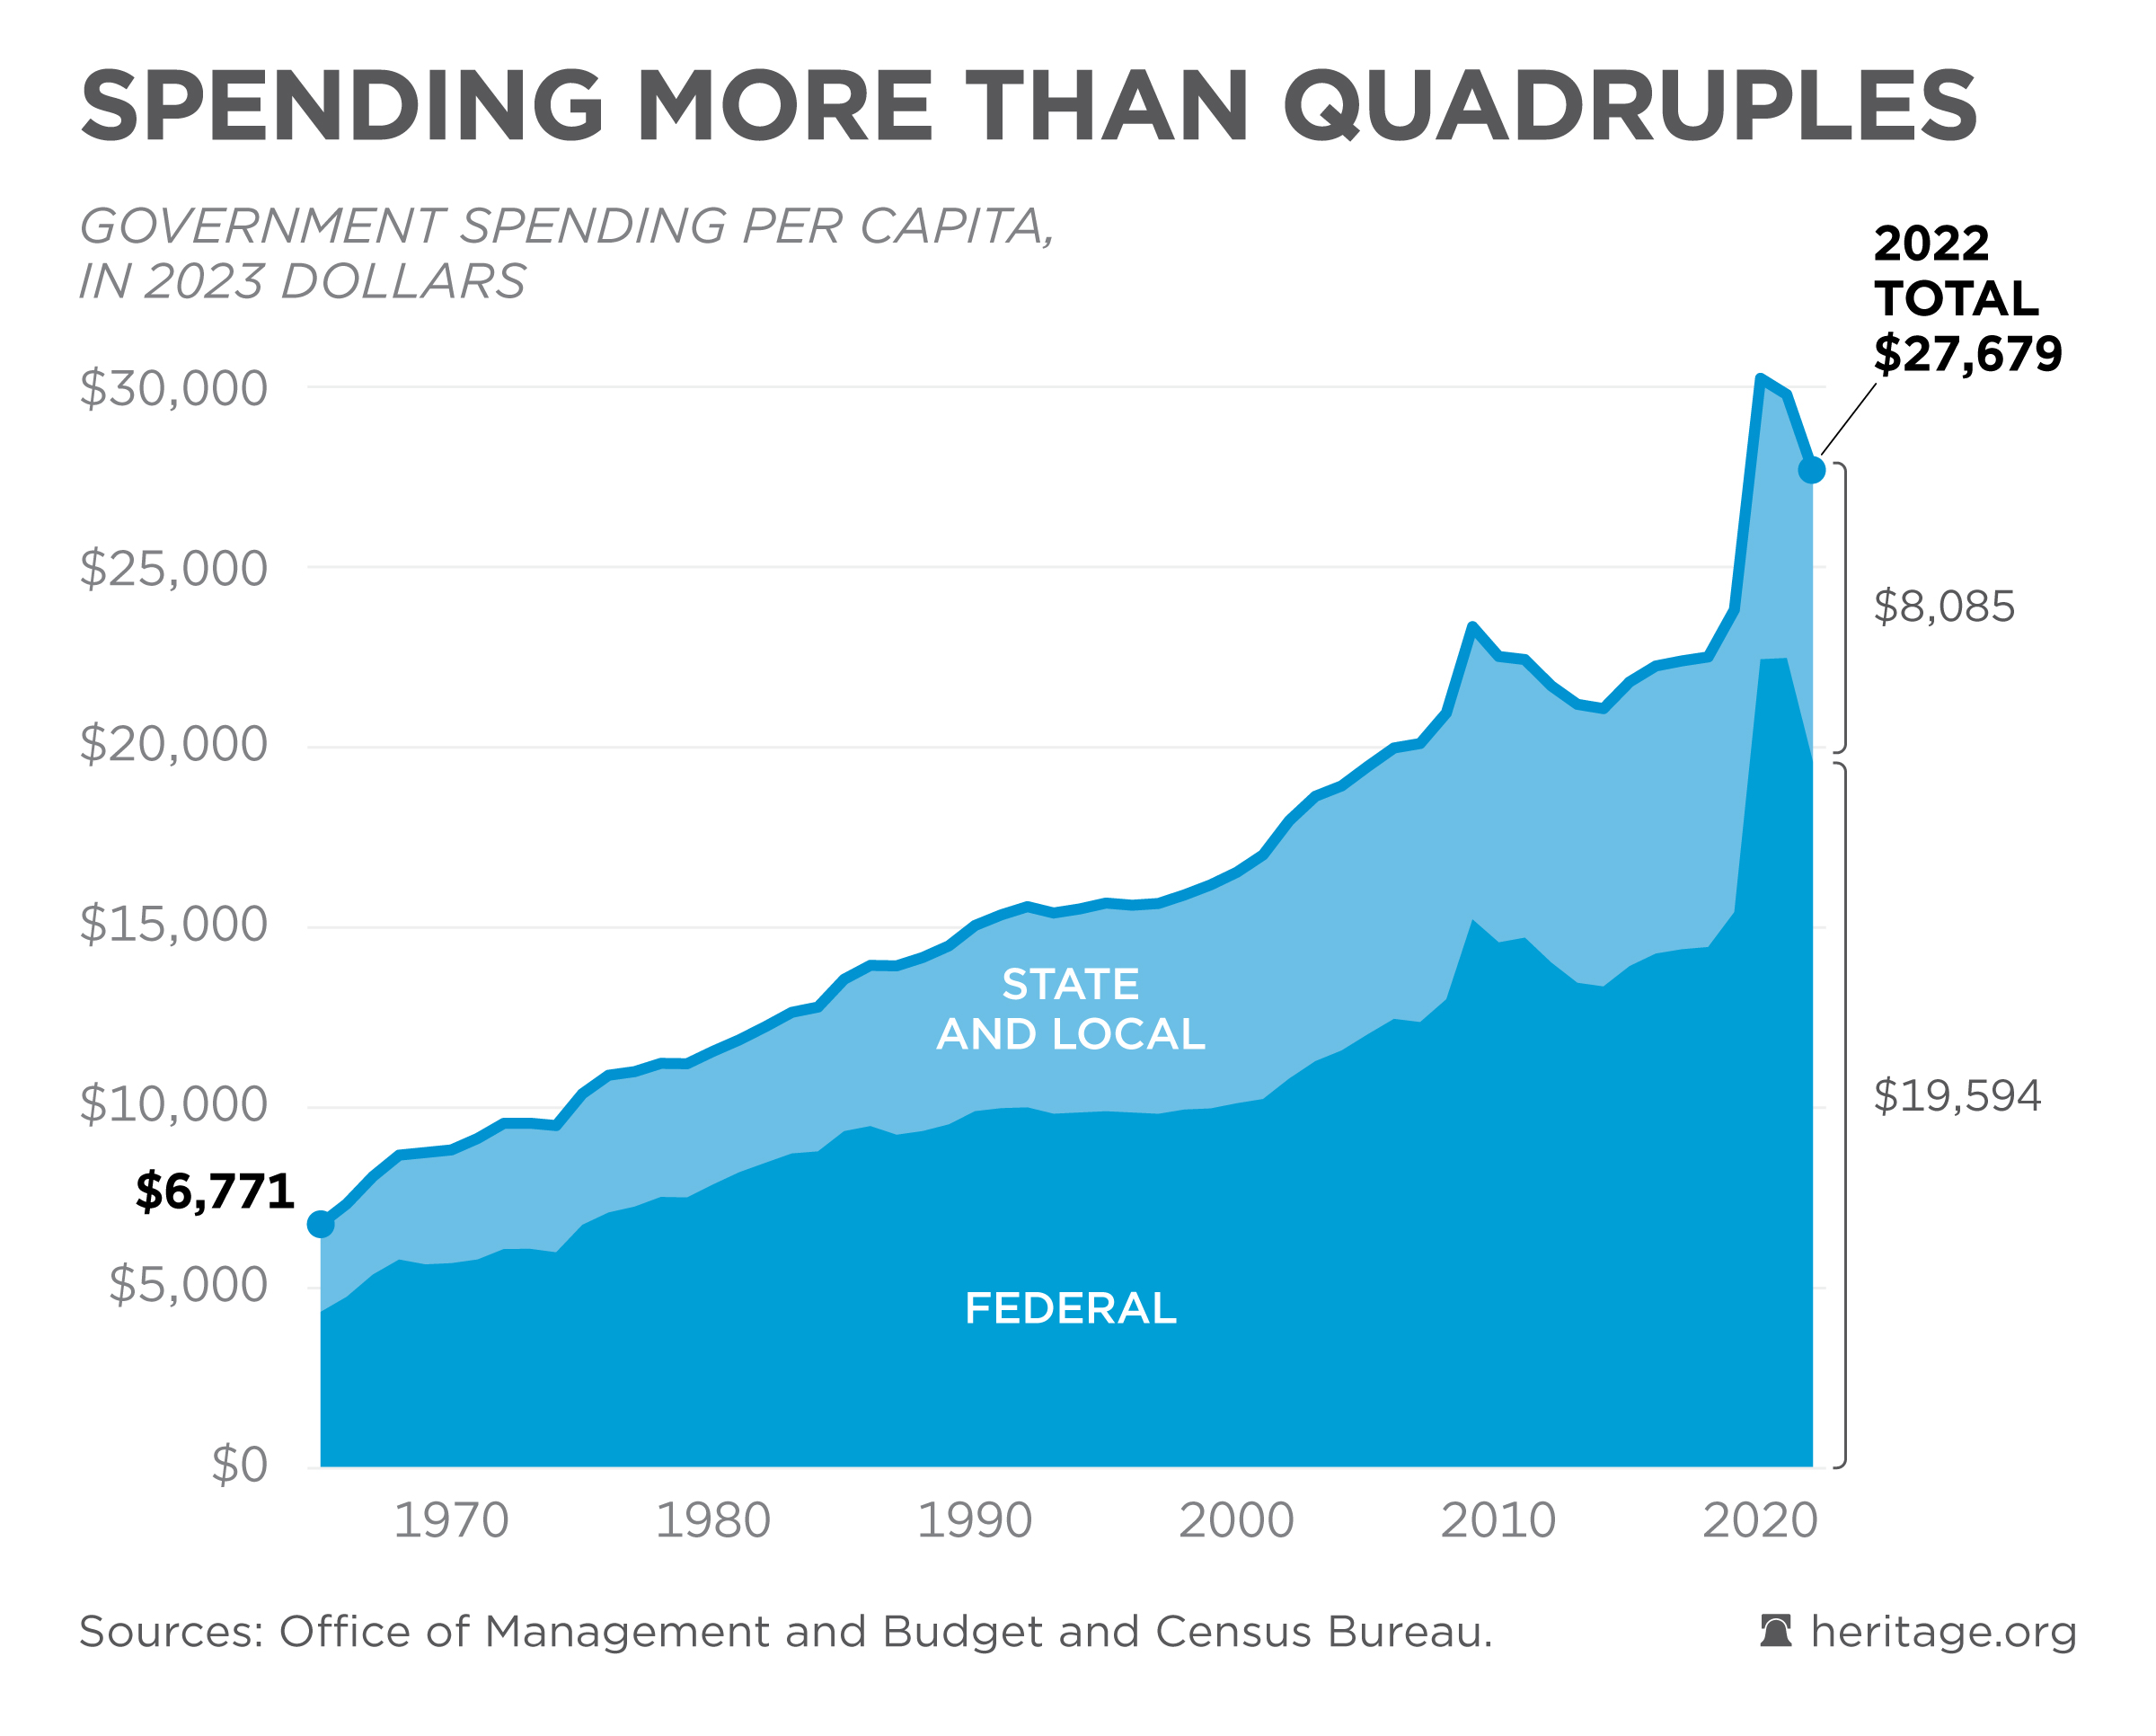
Spending on national defense has declined as a share of the economy since 1962. In contrast, non-defense spending has soared, increasing due to the unsustainable growth of social benefit programs. In 2020, non-defense federal spending hit a record of 26 percent of GDP.
Updated March 28, 2024
Source: Office of Management and Budget


