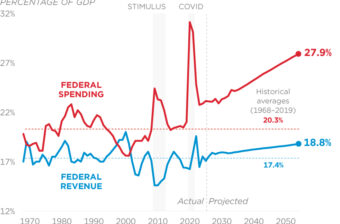
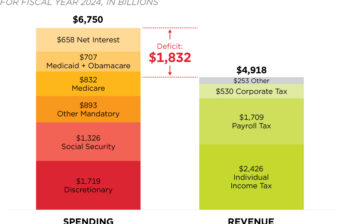
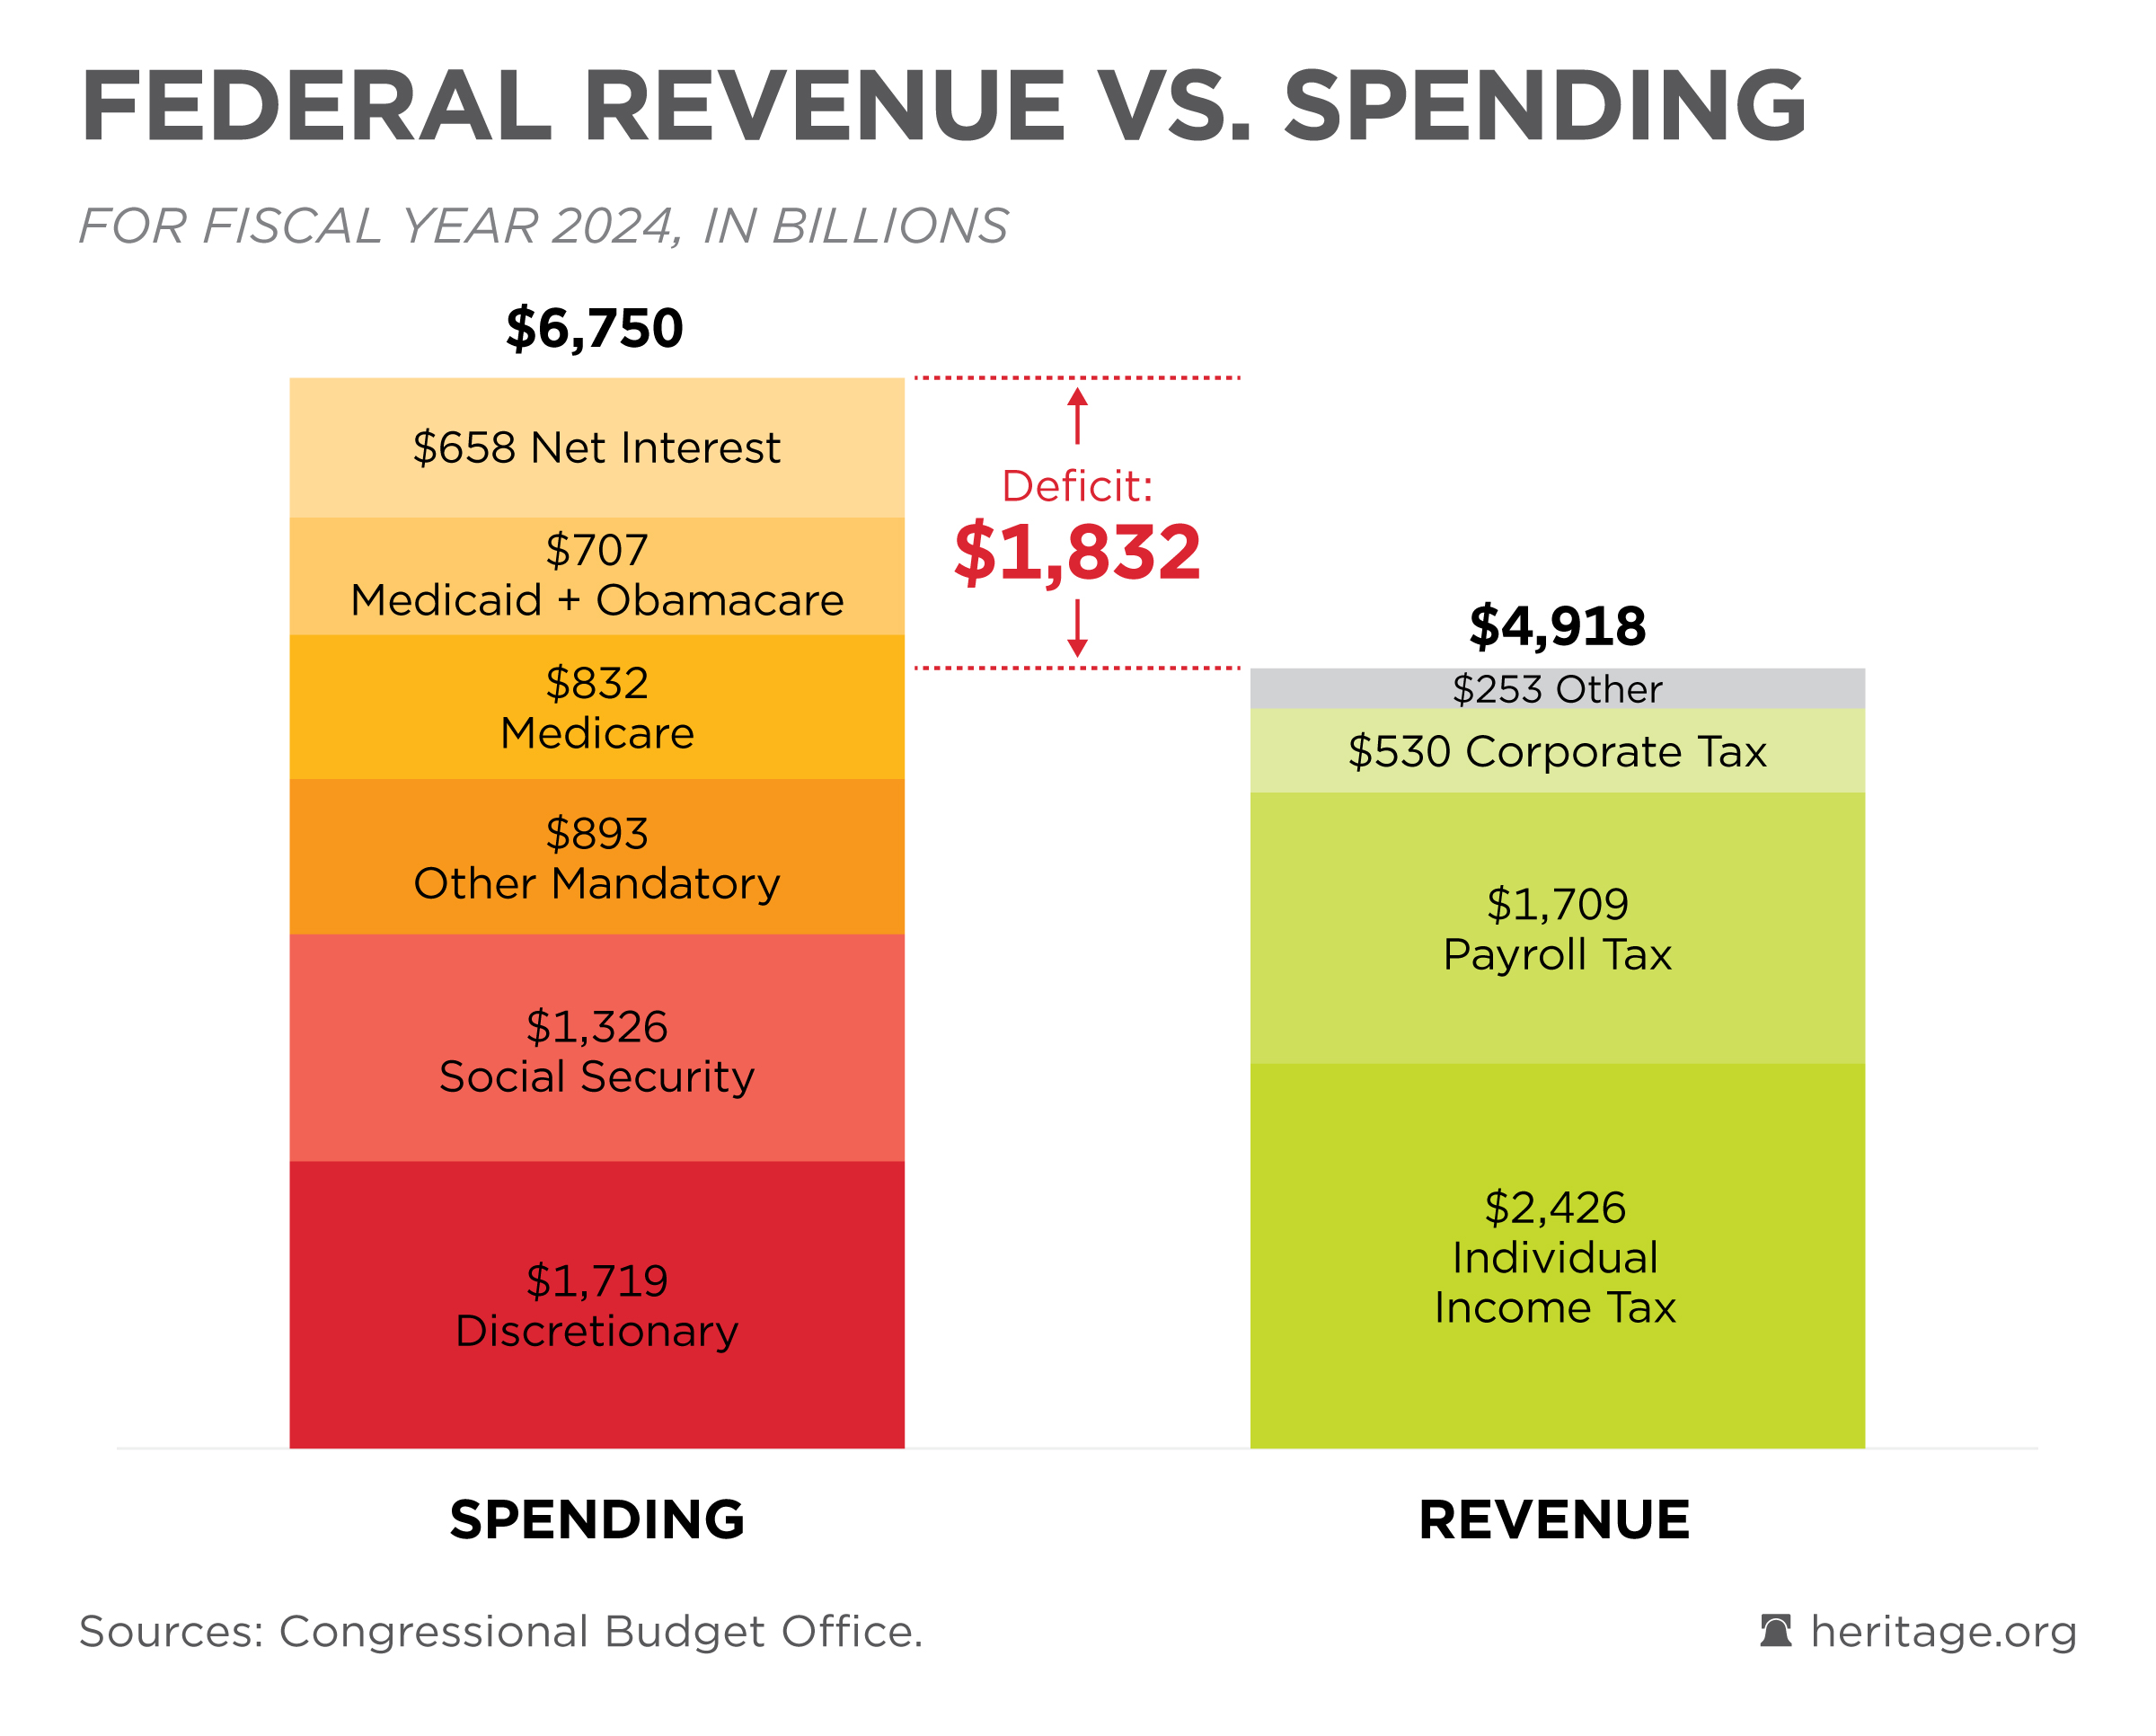
Federal Revenue vs Spending
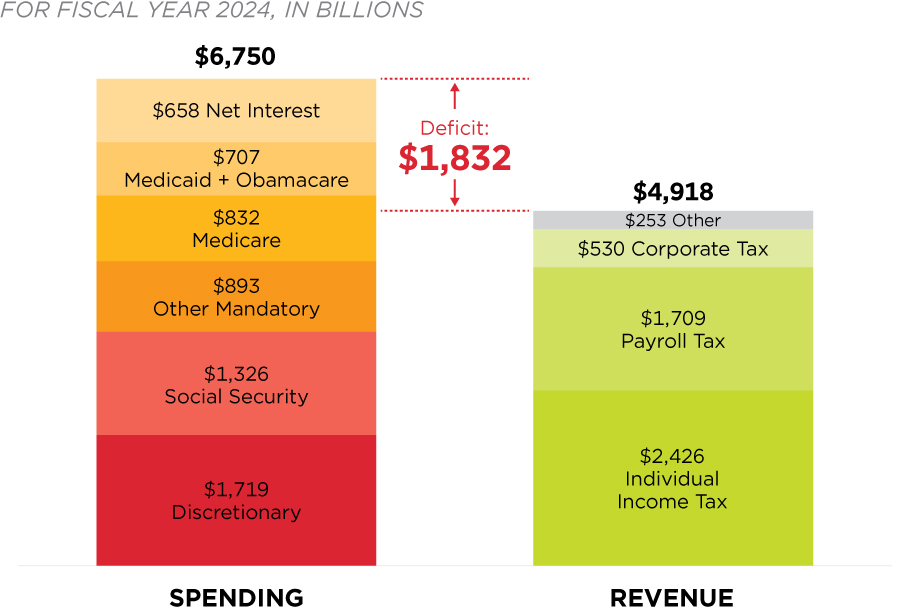
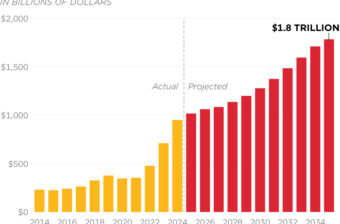
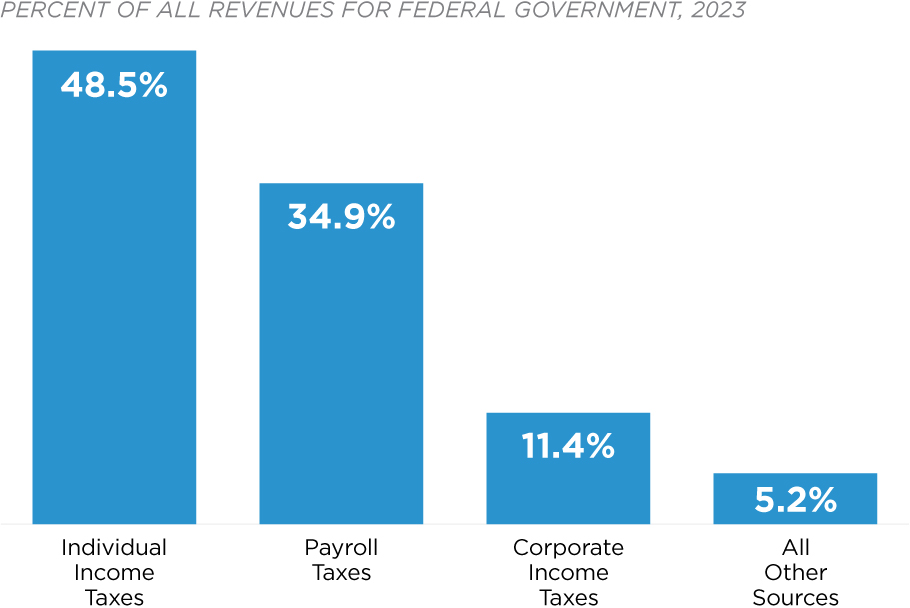
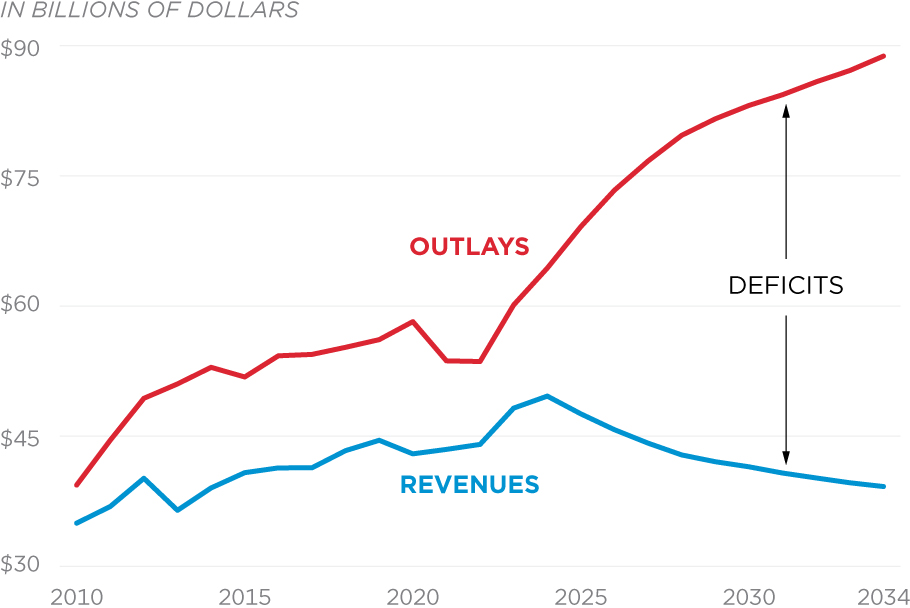
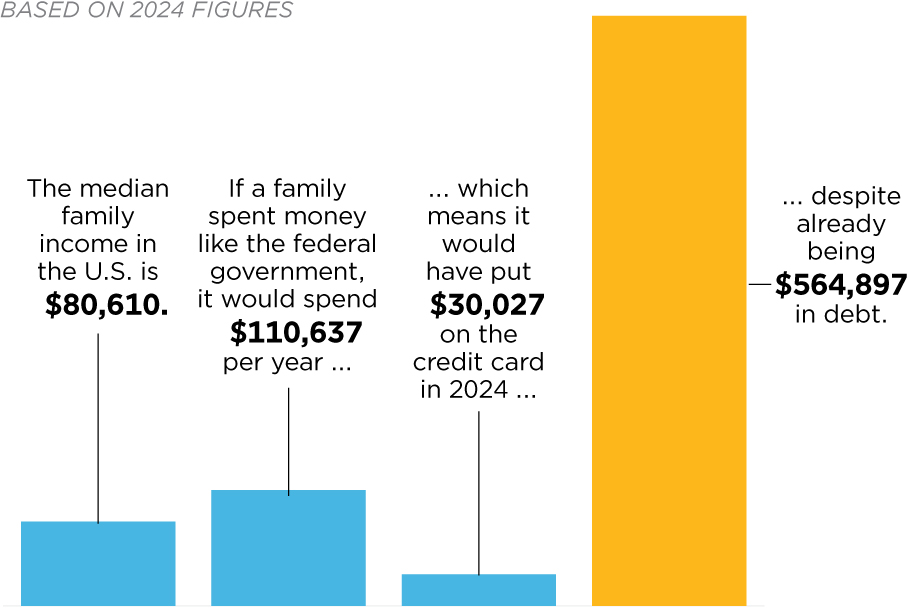
In fiscal year 2023, the federal government took in a whopping $4.4 trillion of revenue. However, because it spent $6.1 trillion, there was a deficit of $1.7 trillion. There is no excuse for such a large deficit during a non-recession peacetime year.

Download
image
Download
floor chart

Created July 24, 2024

Source: CBO

Related Charts
Related Charts

What Funds the Federal Budget?

In 2023, individual income taxes comprised 48 percent of all federal revenues. This is followed by payroll taxes, which provided 35 percent of all revenues.

Download
image
Download
floor chart

Updated August 31, 2023

Source: Congressional Budget Office

Drivers of Growing Spending

Federal spending will increase by more than $3.5 trillion from 2023 through 2033. Three major budget categories—health care, social security, and interest on the debt—will account for 81 percent of this spending growth.

Download
image
Download
floor chart

Updated February 8, 2024

Source: Congressional Budget Office

Related Charts

Where Does All the Money Go?

In 2023, major entitlement programs—Social Security, Medicare, Medicaid, Obamacare, and other health care programs—consumed 50 percent of all federal spending. Soon, this spending will be larger than the portion of spending for all other priorities (such as national defense) combined.

Download
image
Download
floor chart

Updated March 28, 2024

Source: Office of Management and Budget

Related Charts
Related Charts

How to Balance the Budget

Absent reform, the Congressional Budget Office projects that budget deficits will rise sharply over the coming decade. Heritage’s budget plan—Blueprint for Balance—reforms entitlements, right-sizes discretionary spending, eliminates deficits, and reduces taxes.

Additional Sources: Office of Management and Budget The Heritage Foundation’s Calculations

Download
image
Download
floor chart
Related Charts