Public Debt at Highest Since 1946
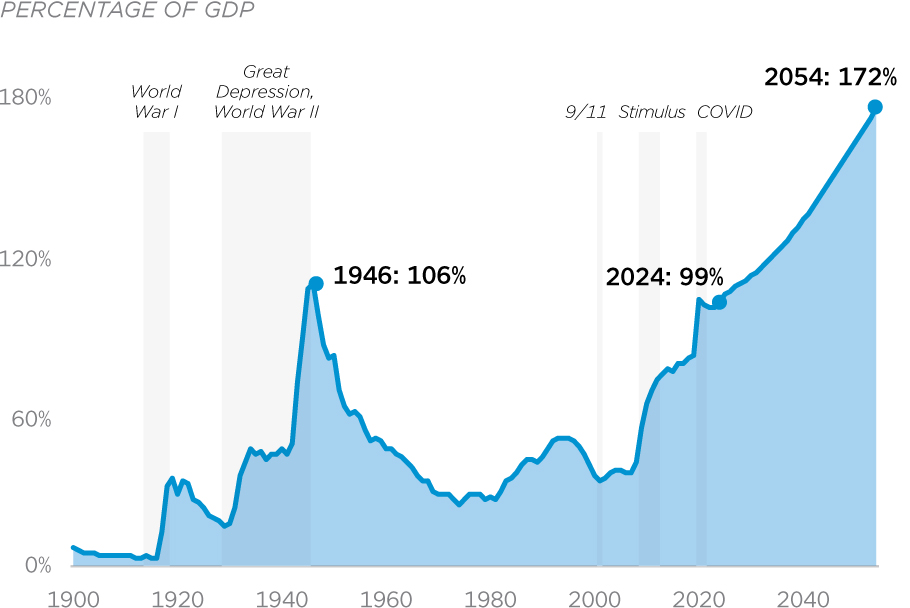
Due to unchecked federal spending, publicly held federal debt is at its highest level since World War II.
Updated February 8, 2024
Source: Congressional Budget Office

Due to unchecked federal spending, publicly held federal debt is at its highest level since World War II.
Updated February 8, 2024
Source: Congressional Budget Office
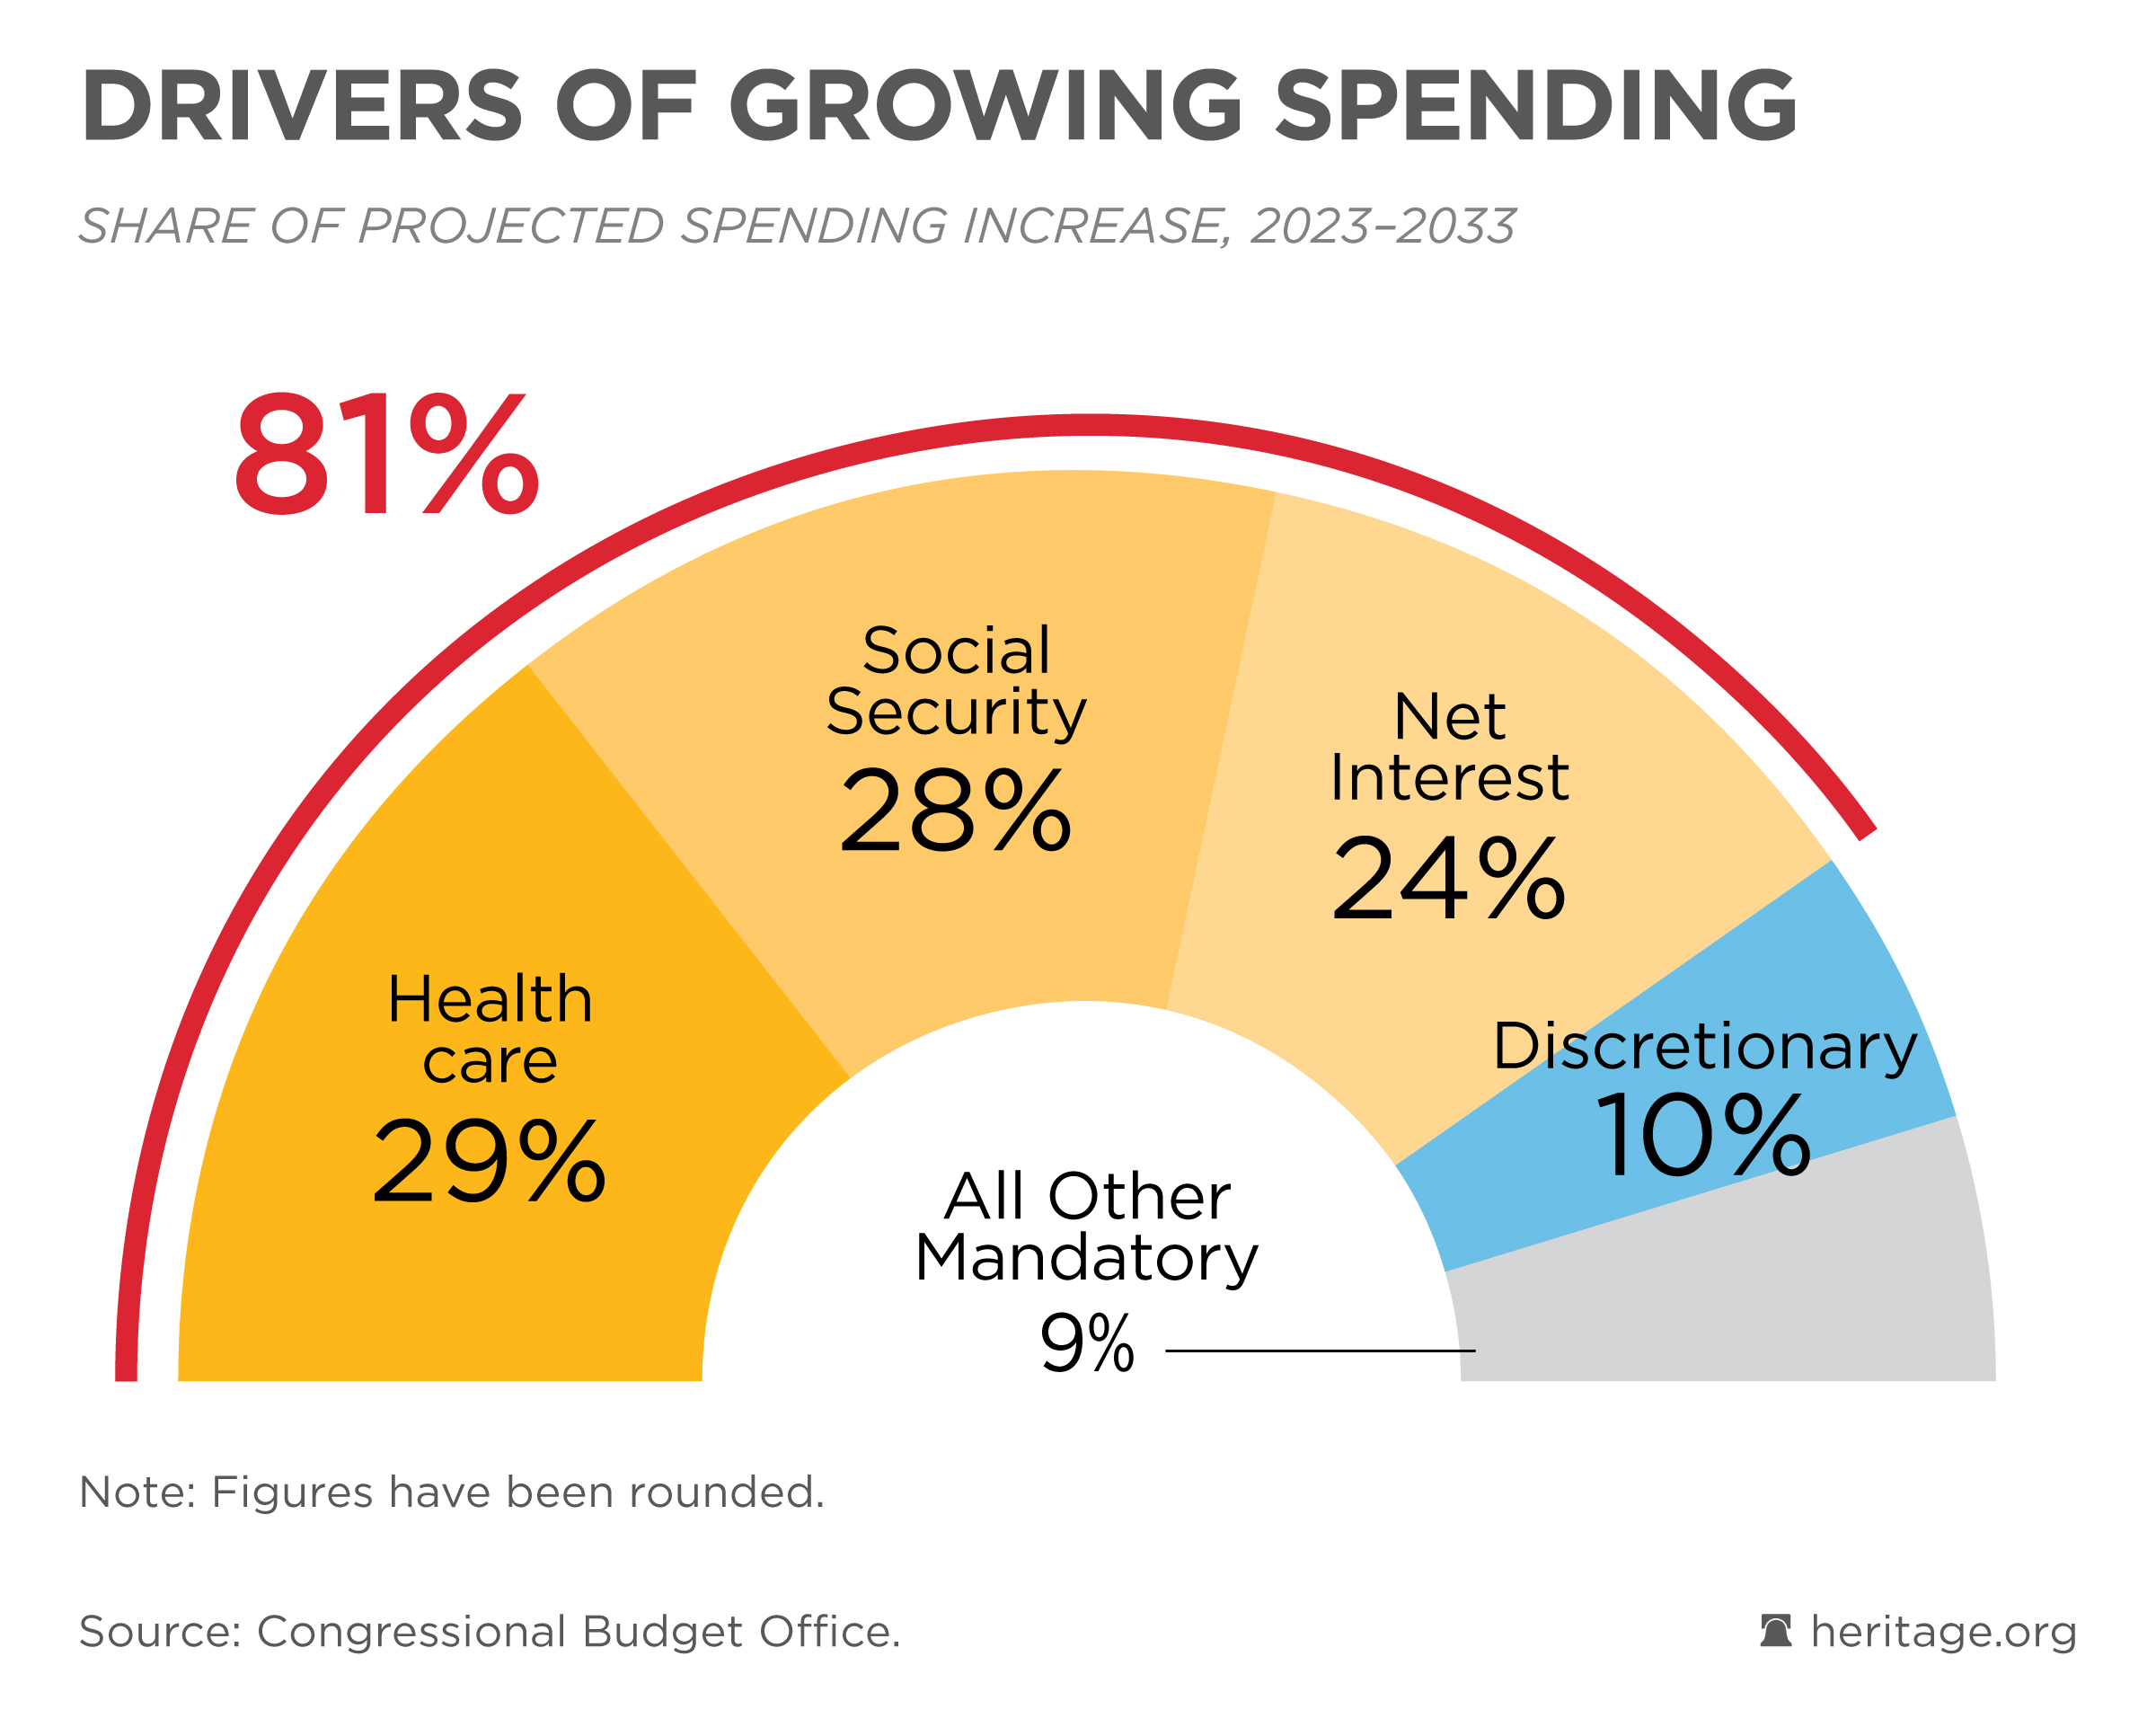
Federal spending will increase by more than $3.5 trillion from 2023 through 2033. Three major budget categories—health care, social security, and interest on the debt—will account for 81 percent of this spending growth.
Updated February 8, 2024
Source: Congressional Budget Office
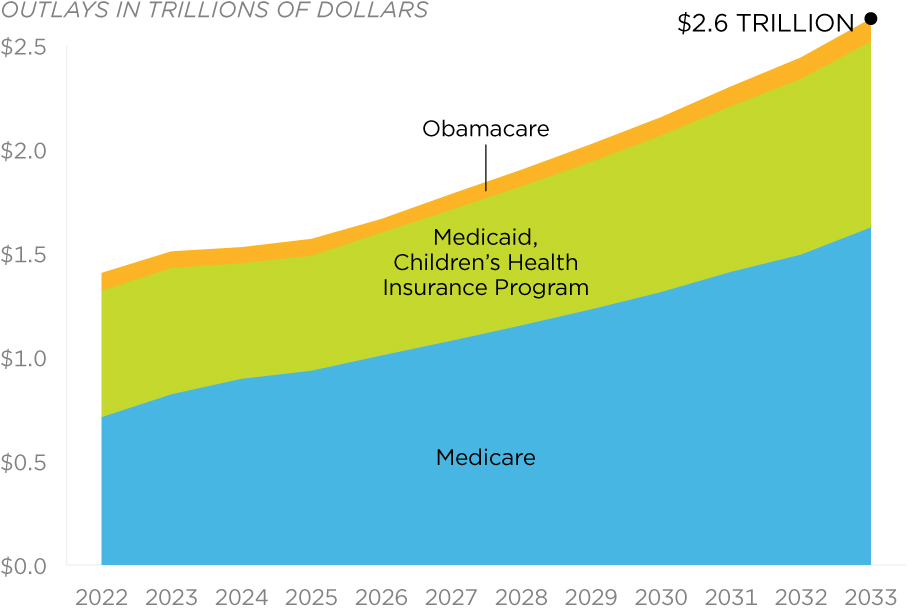
Health care spending already consumes more of the federal budget than any other area.
Updated March 9, 2023
Source: Congressional Budget Office
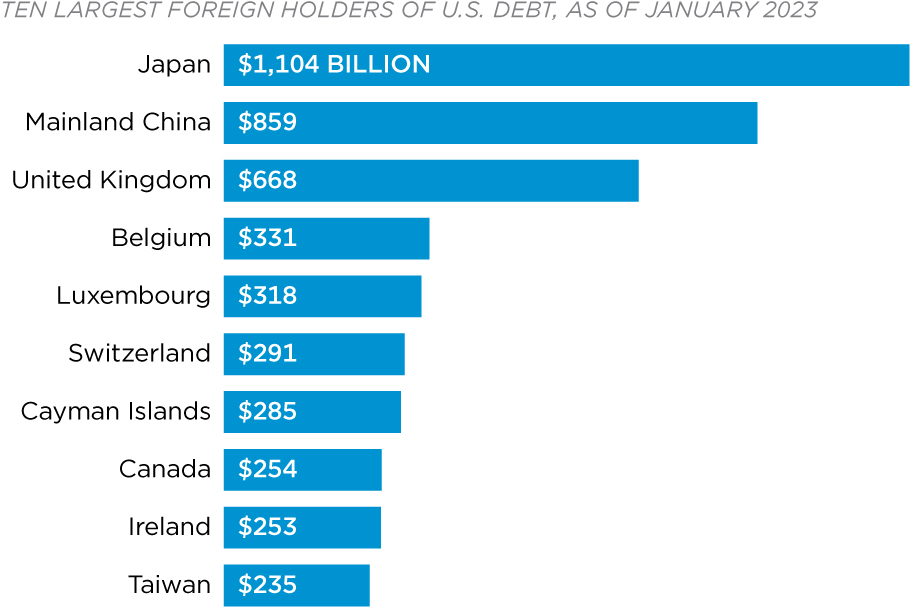
To finance borrowing, the U.S. government sells treasury securities domestically and abroad. Foreign governments, individuals, and institutions then buy these securities as an investment. Currently, mainland China is the second-largest foreign owner of U.S. national debt with $859 billion.
Updated August 31, 2023
Source: U.S. Treasury Department
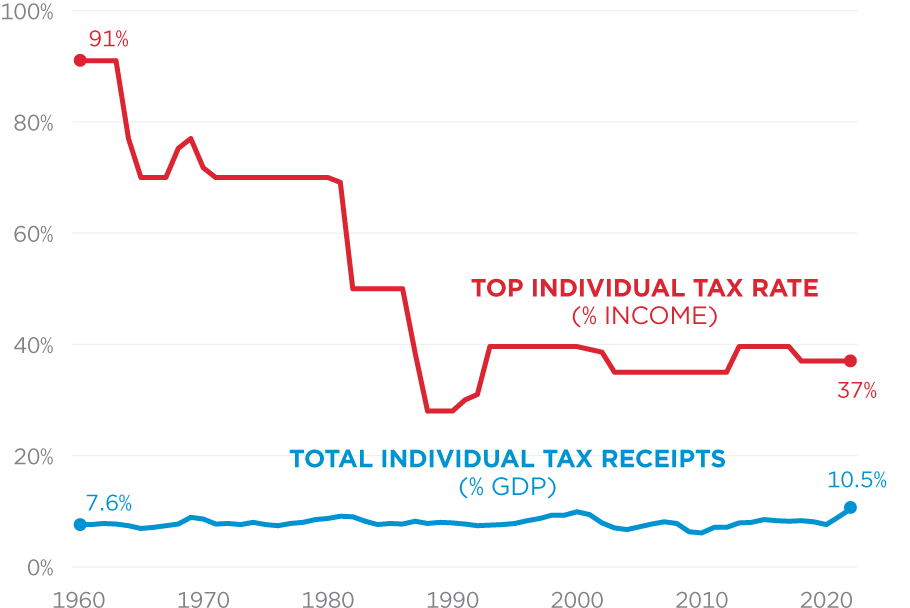
Despite the top individual tax rate fluctuating between 91 and 28 percent over the past 50 years, total individual tax receipts have remained fairly stable. The top rate decreased in 2018 and is now at 37 percent.
Additional Sources: Internal Revenue Service
Updated May 16, 2023
Source: Office of Management and Budget
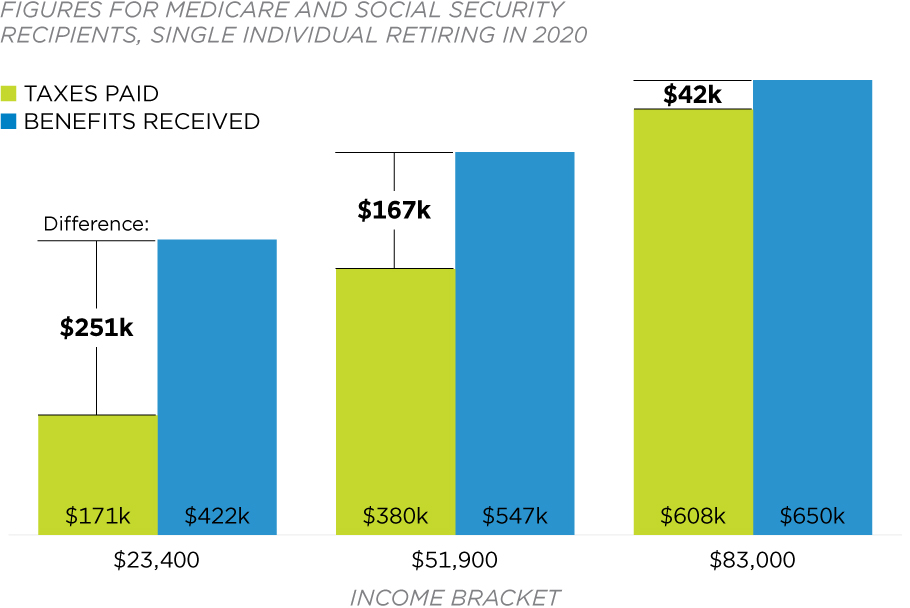
Lower- and middle-income Americans who work every year from ages 22 to 65 will pay between $171,000 and $608,000 in payroll taxes for Medicare and Social Security, depending on their income bracket. And though they will receive more in Medicare and Social Security benefits than they paid for, Social Security is a bad deal for workers and their families because they could receive two- to three-times as much, on average, from saving and investing their own money, without adding to the debt burden for younger generations.
Updated May 10, 2019
Source: Urban Institute
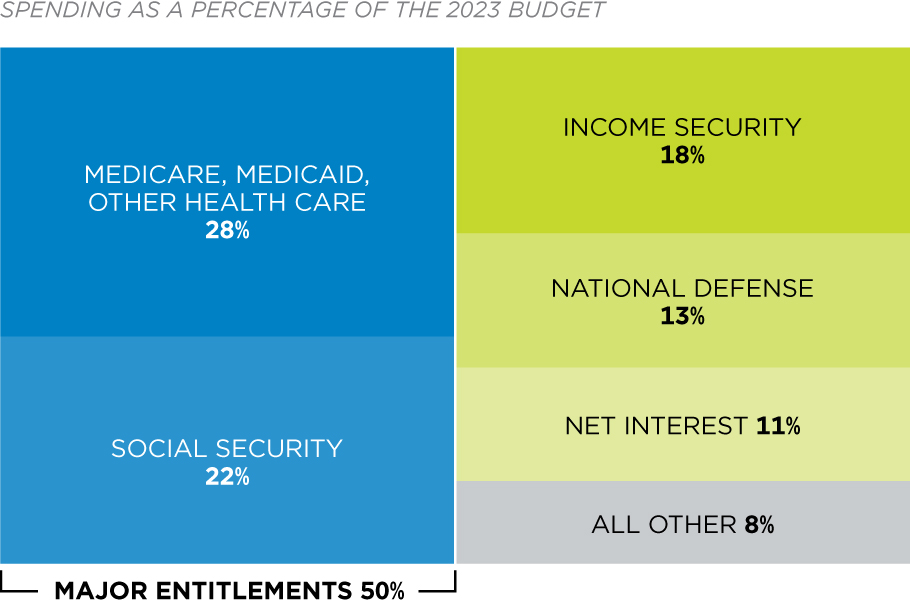
In 2023, major entitlement programs—Social Security, Medicare, Medicaid, Obamacare, and other health care programs—consumed 50 percent of all federal spending. Soon, this spending will be larger than the portion of spending for all other priorities (such as national defense) combined.
Updated March 28, 2024
Source: Office of Management and Budget
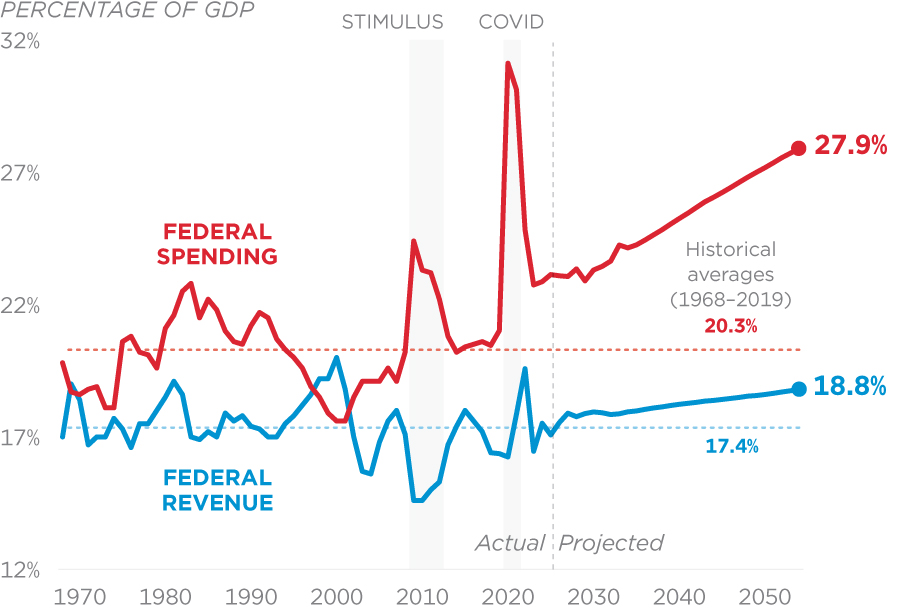
Federal spending is on an unsustainable trajectory, and is the key driver of growing deficits and debt. Spending is growing faster than the economy. Raising taxes is not a workable solution because taxes cannot grow faster than the economic base in the long run.
Updated February 8, 2024
Source: Congressional Budget Office
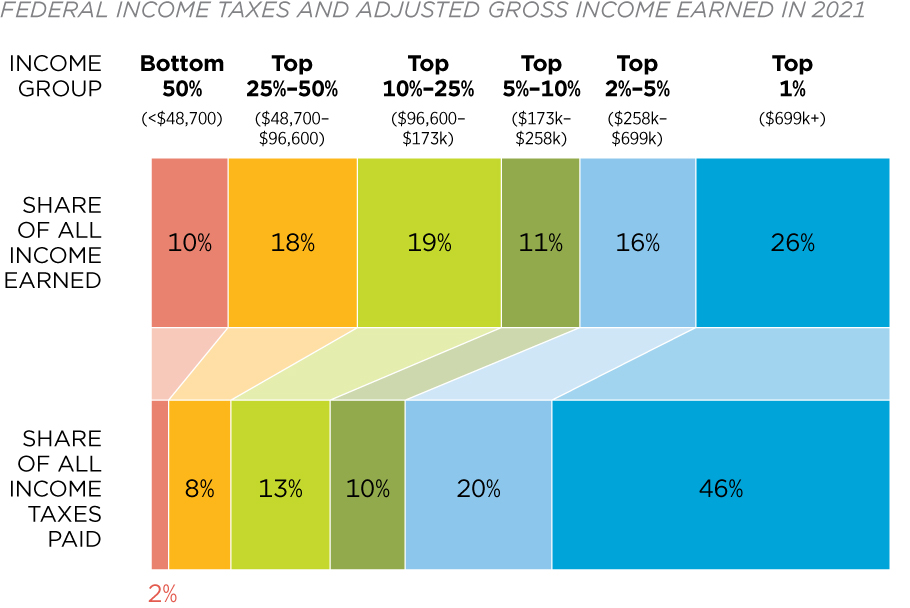
Top earners remain targets for tax increases, but the federal income tax system is already highly progressive. In 2021, the latest year with available data, the top 1 percent of income earners earned 26 percent of all income and paid 46 percent of all federal income taxes – more than the bottom 95 percent combined (33 percent).
Updated June 27, 2024
Source: Internal Revenue Service
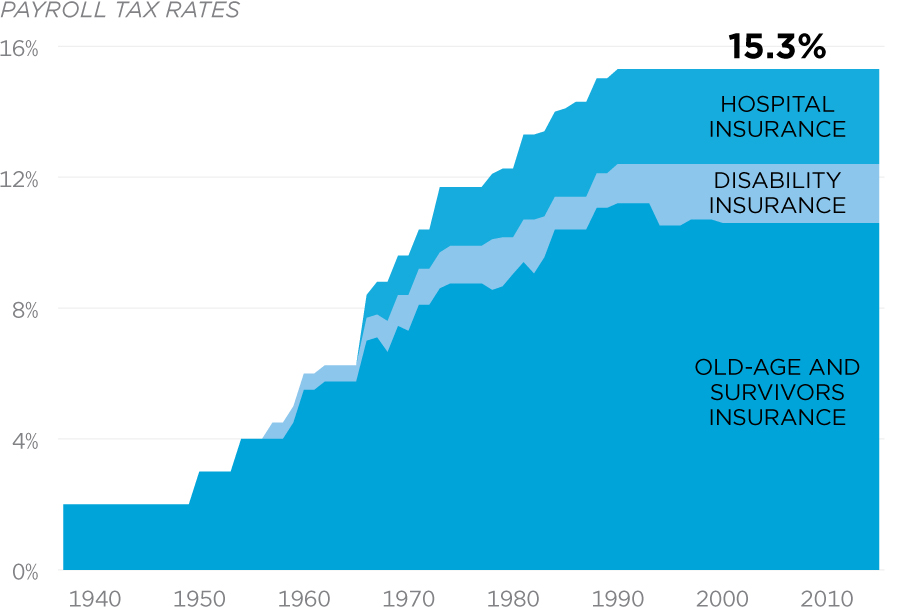 Without reforms, spending on Medicare and Social Security is threatening even higher payroll taxes for workers.
Additional Sources: Social Security Administration
Source: Social Security Administration