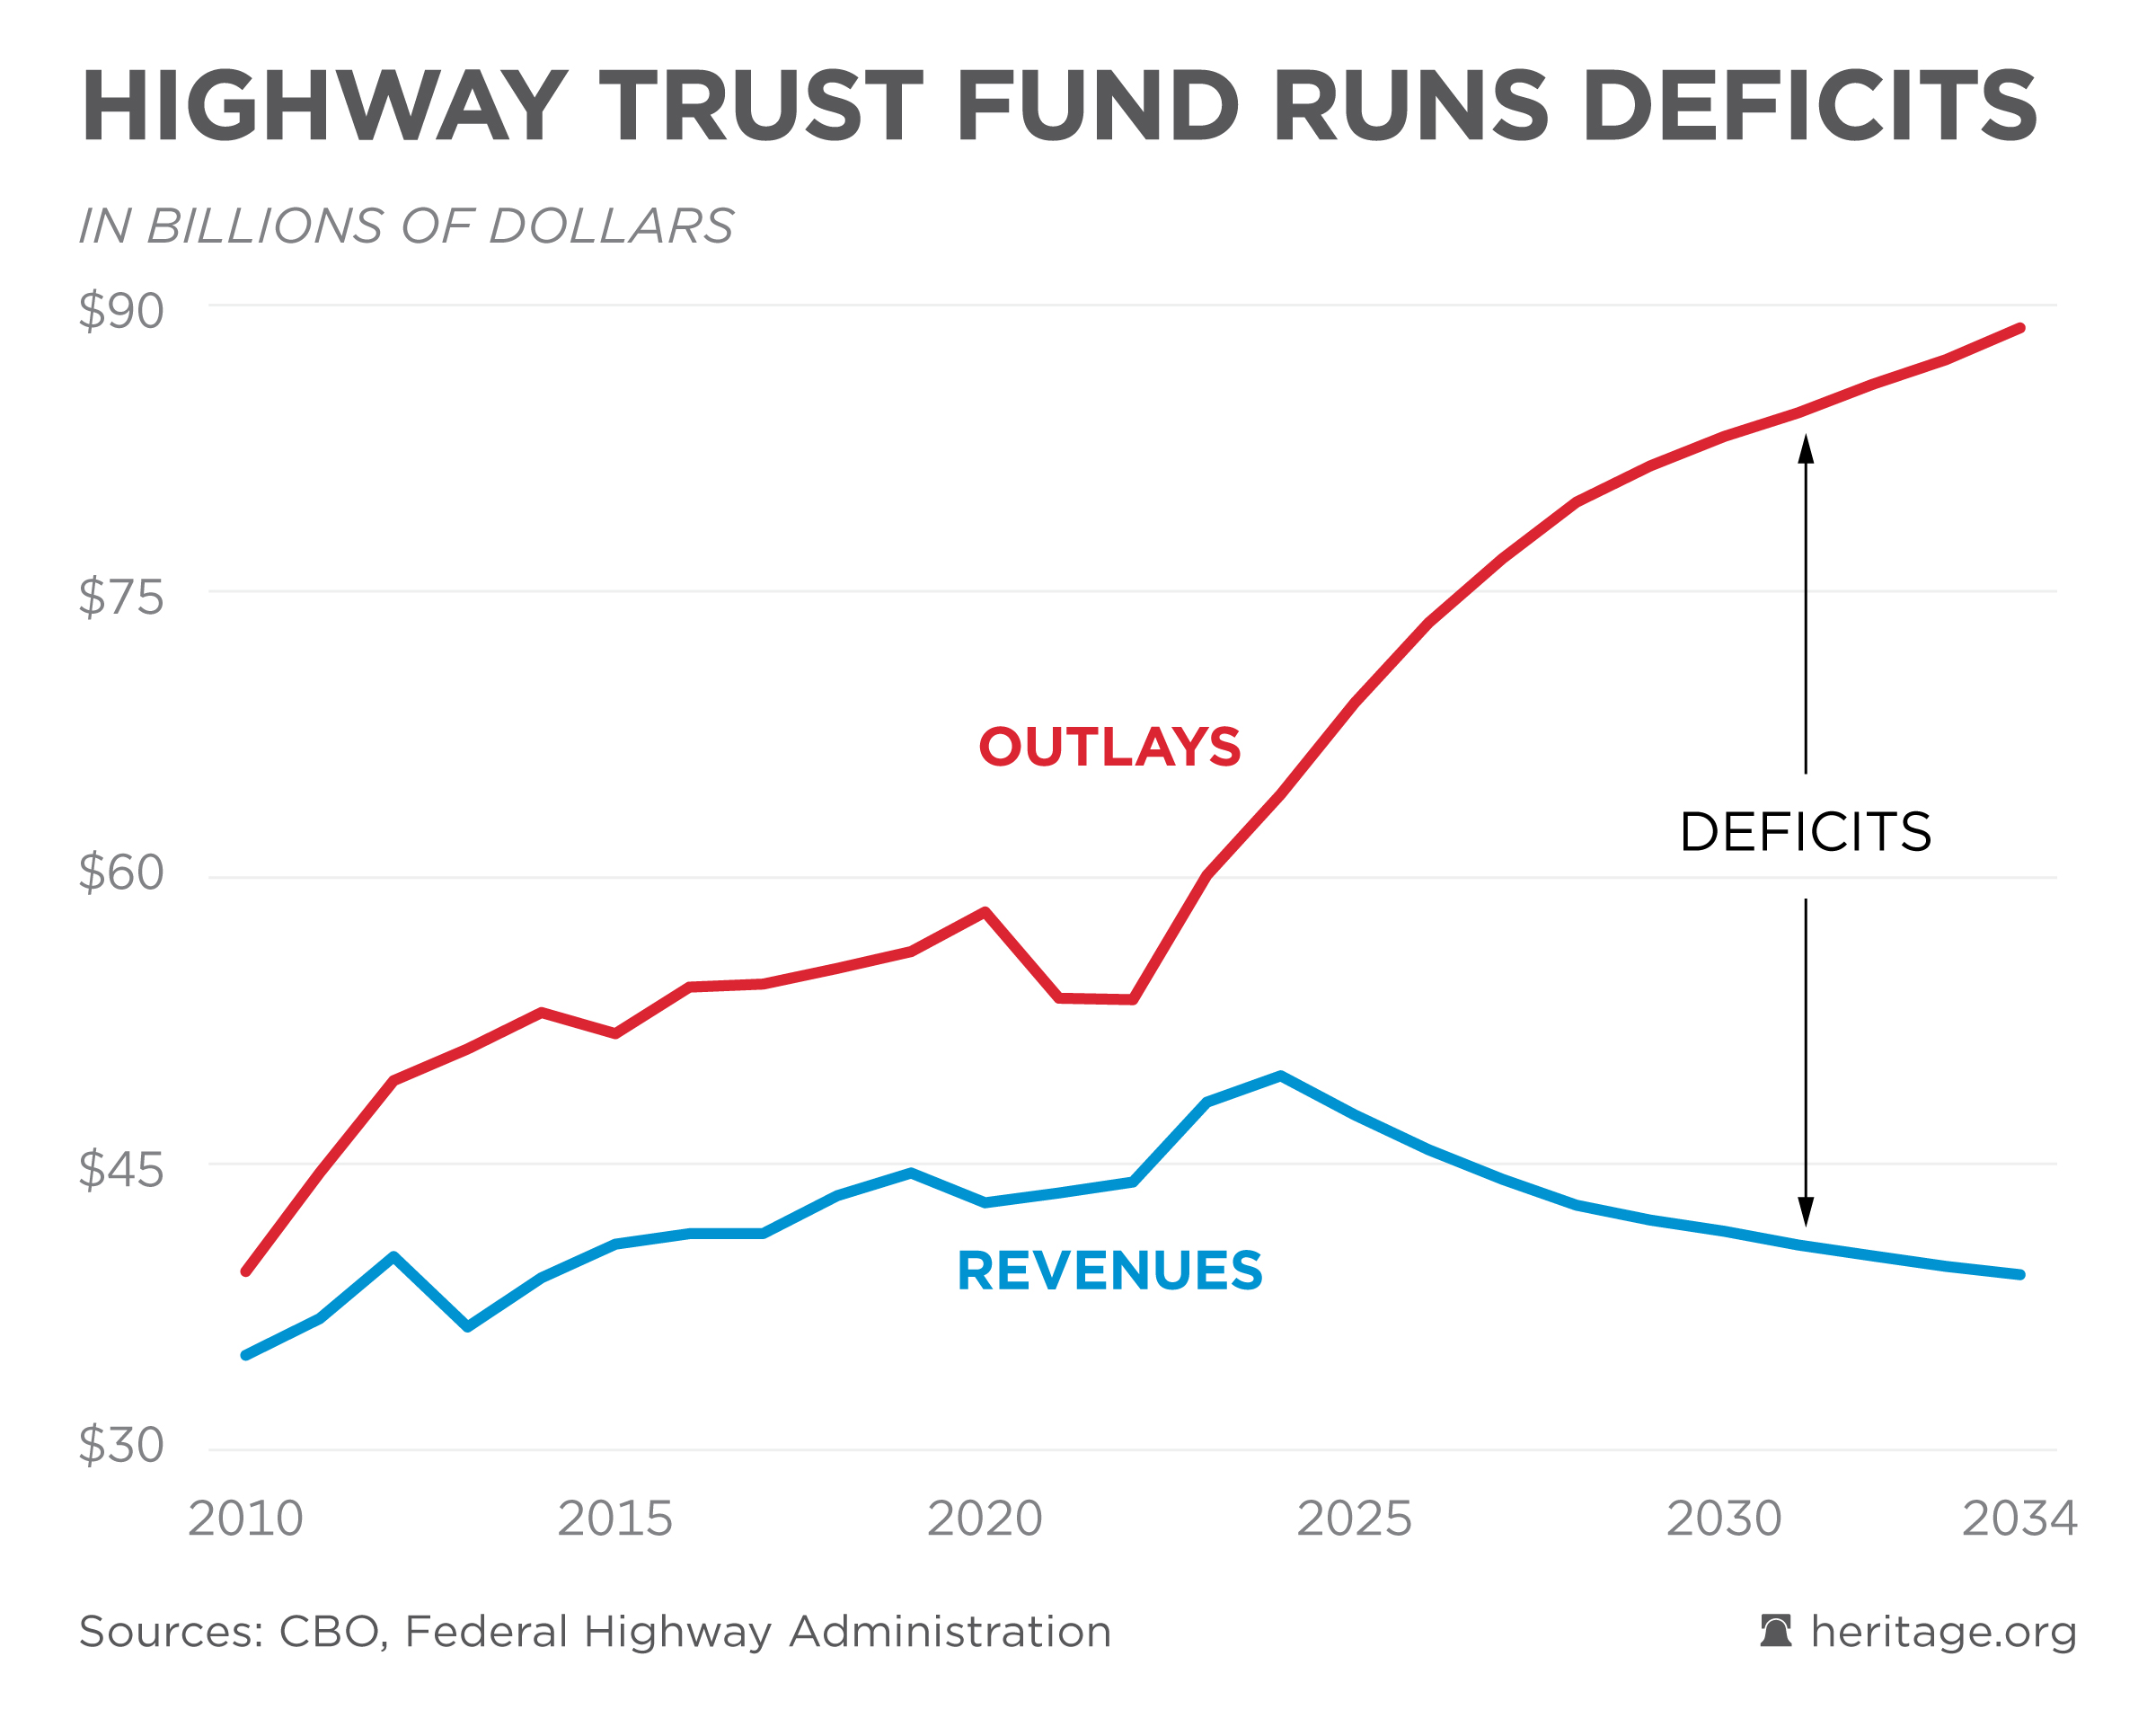
Highway Trust Fund Runs Deficits
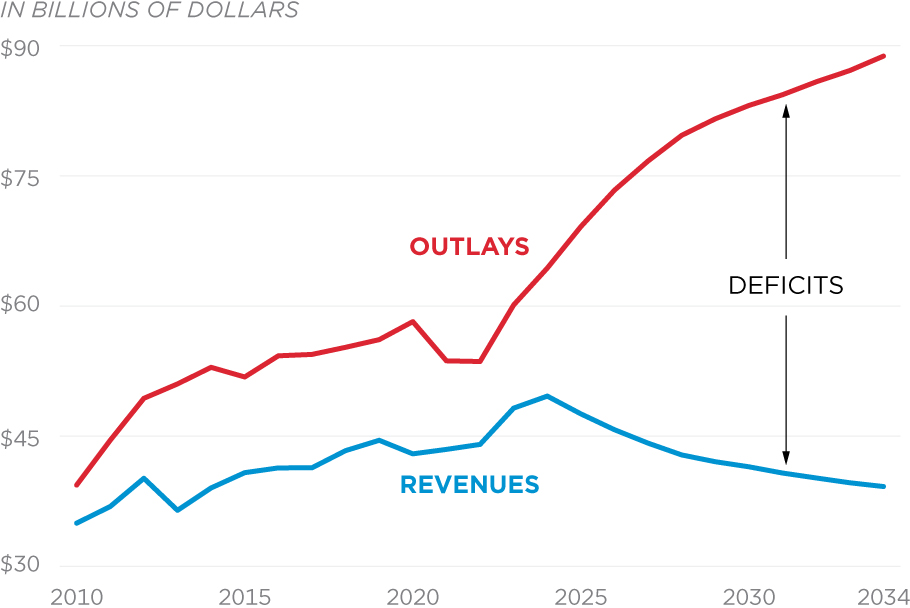
Spending from the Highway Trust Fund consistently exceeds revenues, and Congress made these deficits worse with the 2021 infrastructure package.
Additional Sources: Federal Highway Administration
Updated February 8, 2024
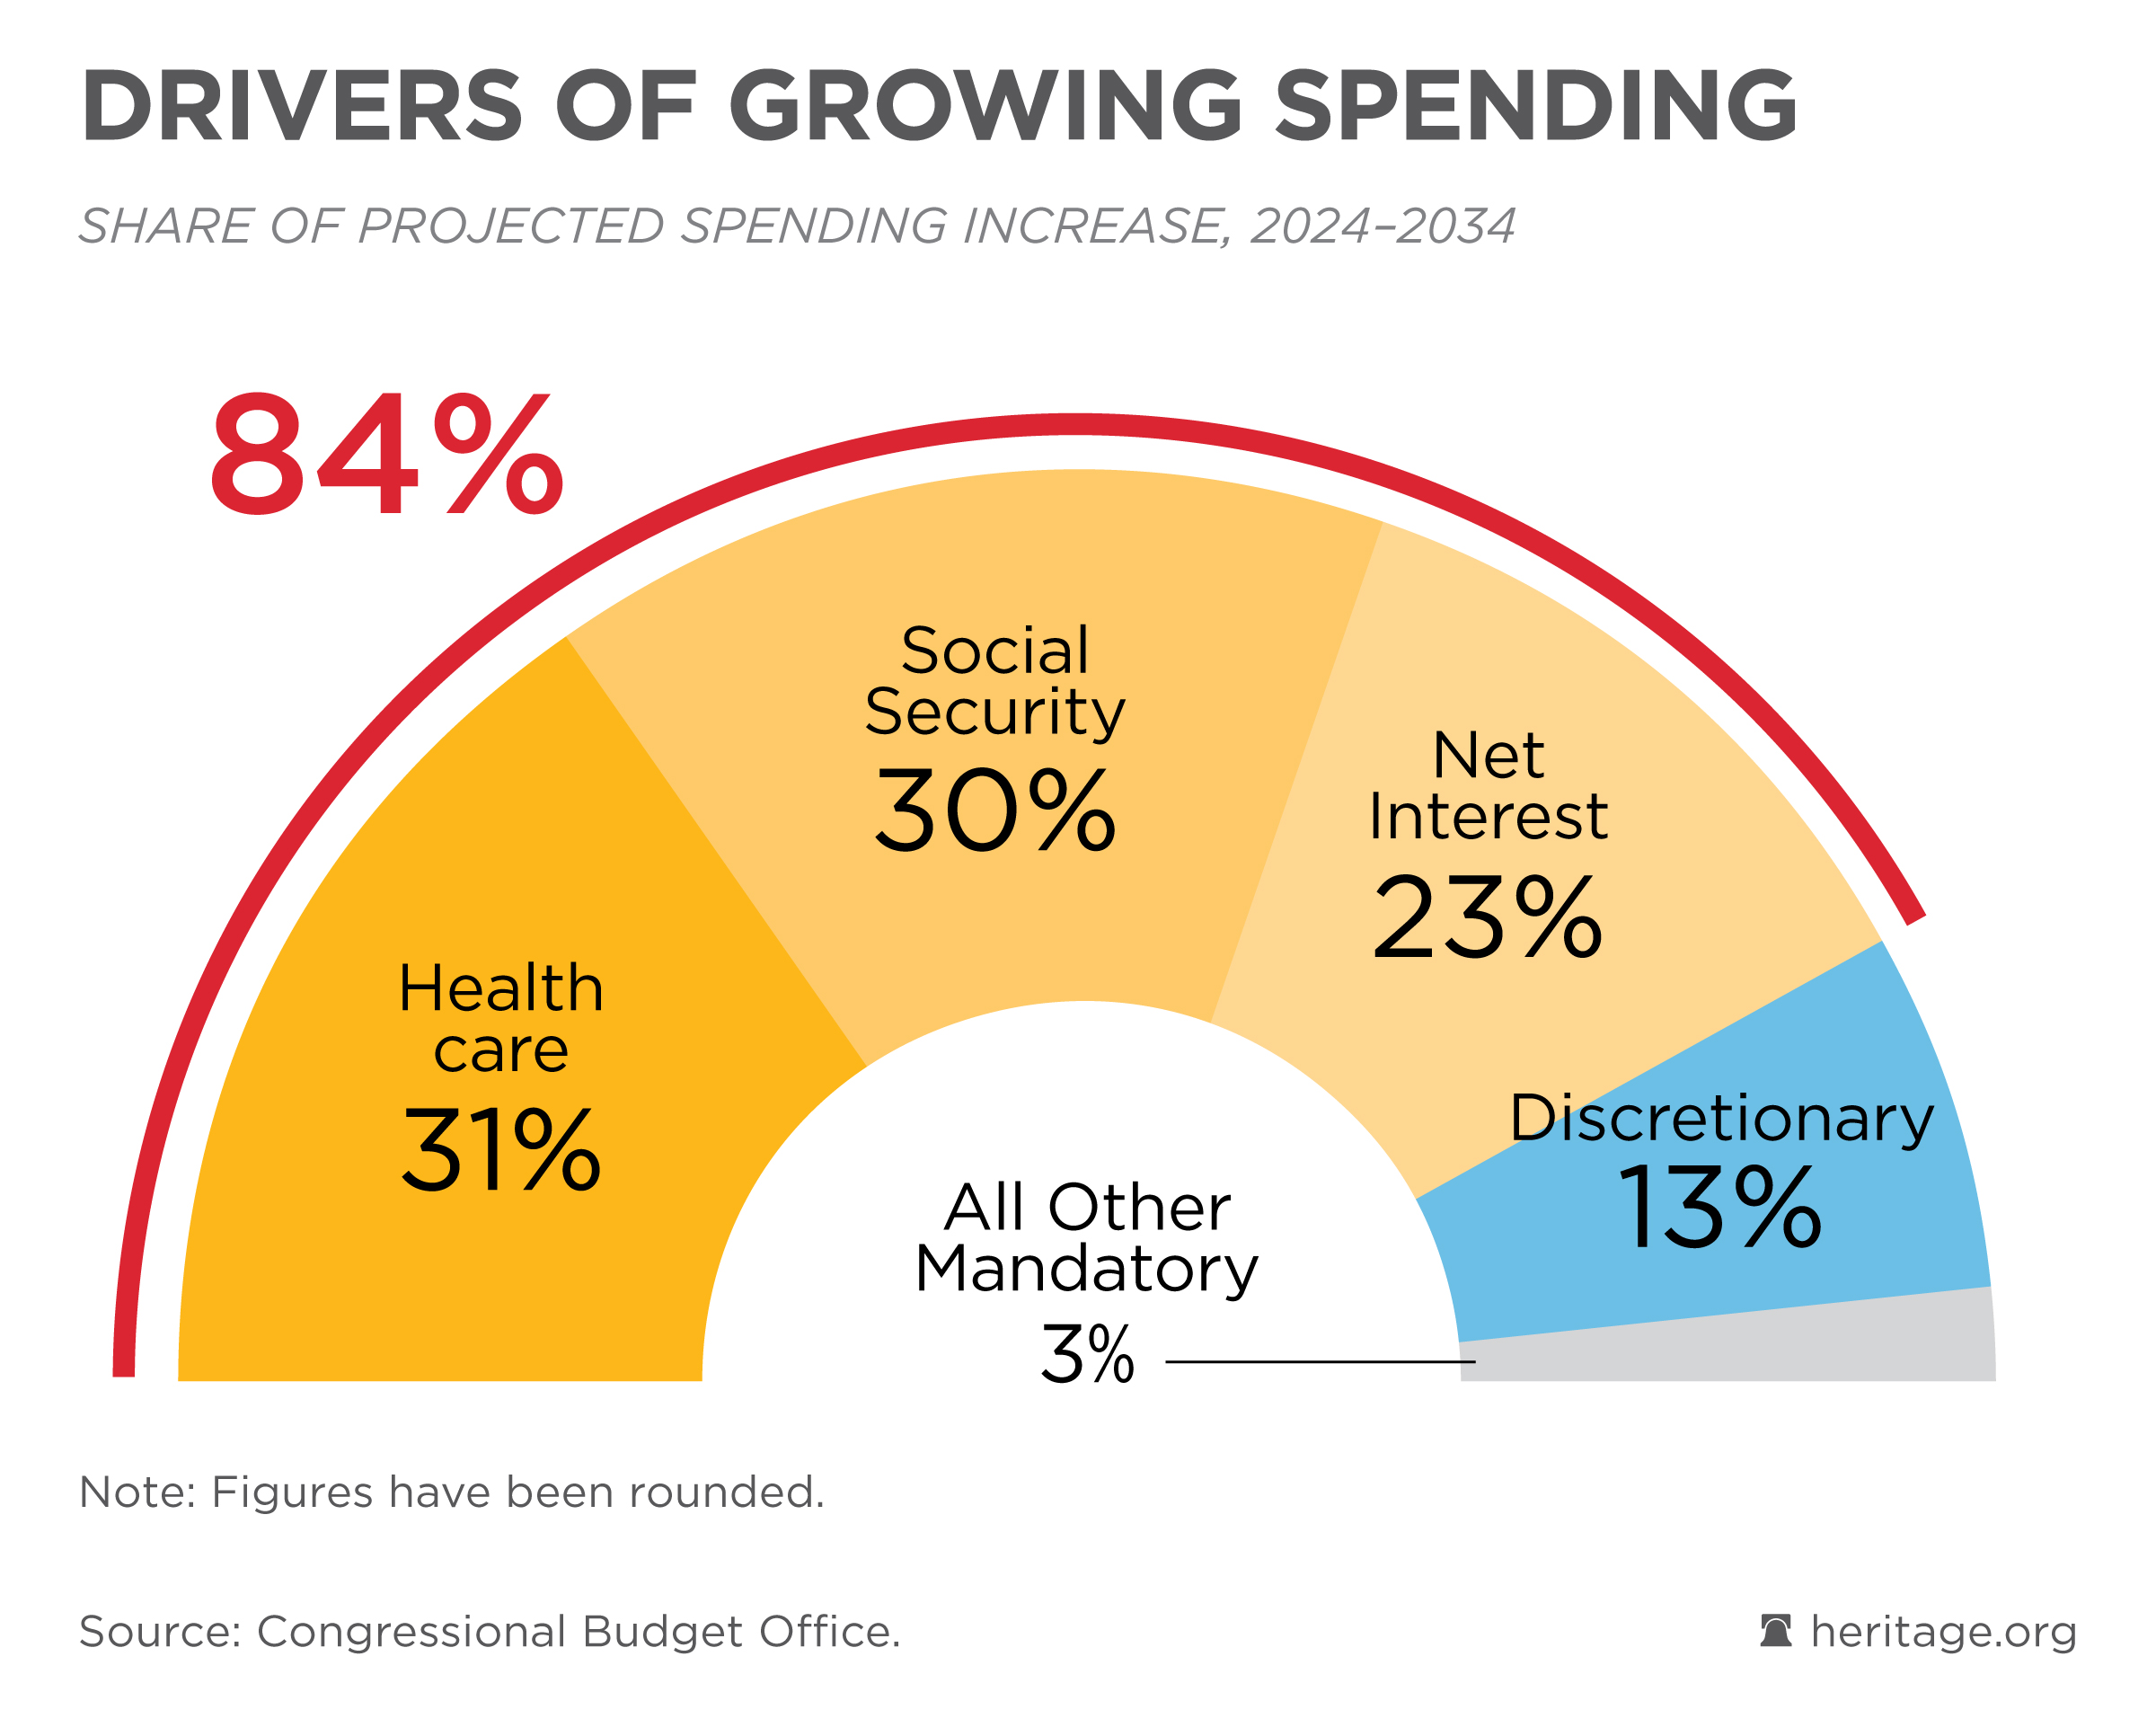
Source: Congressional Budget Office


