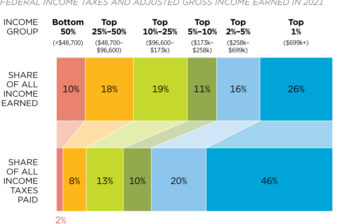
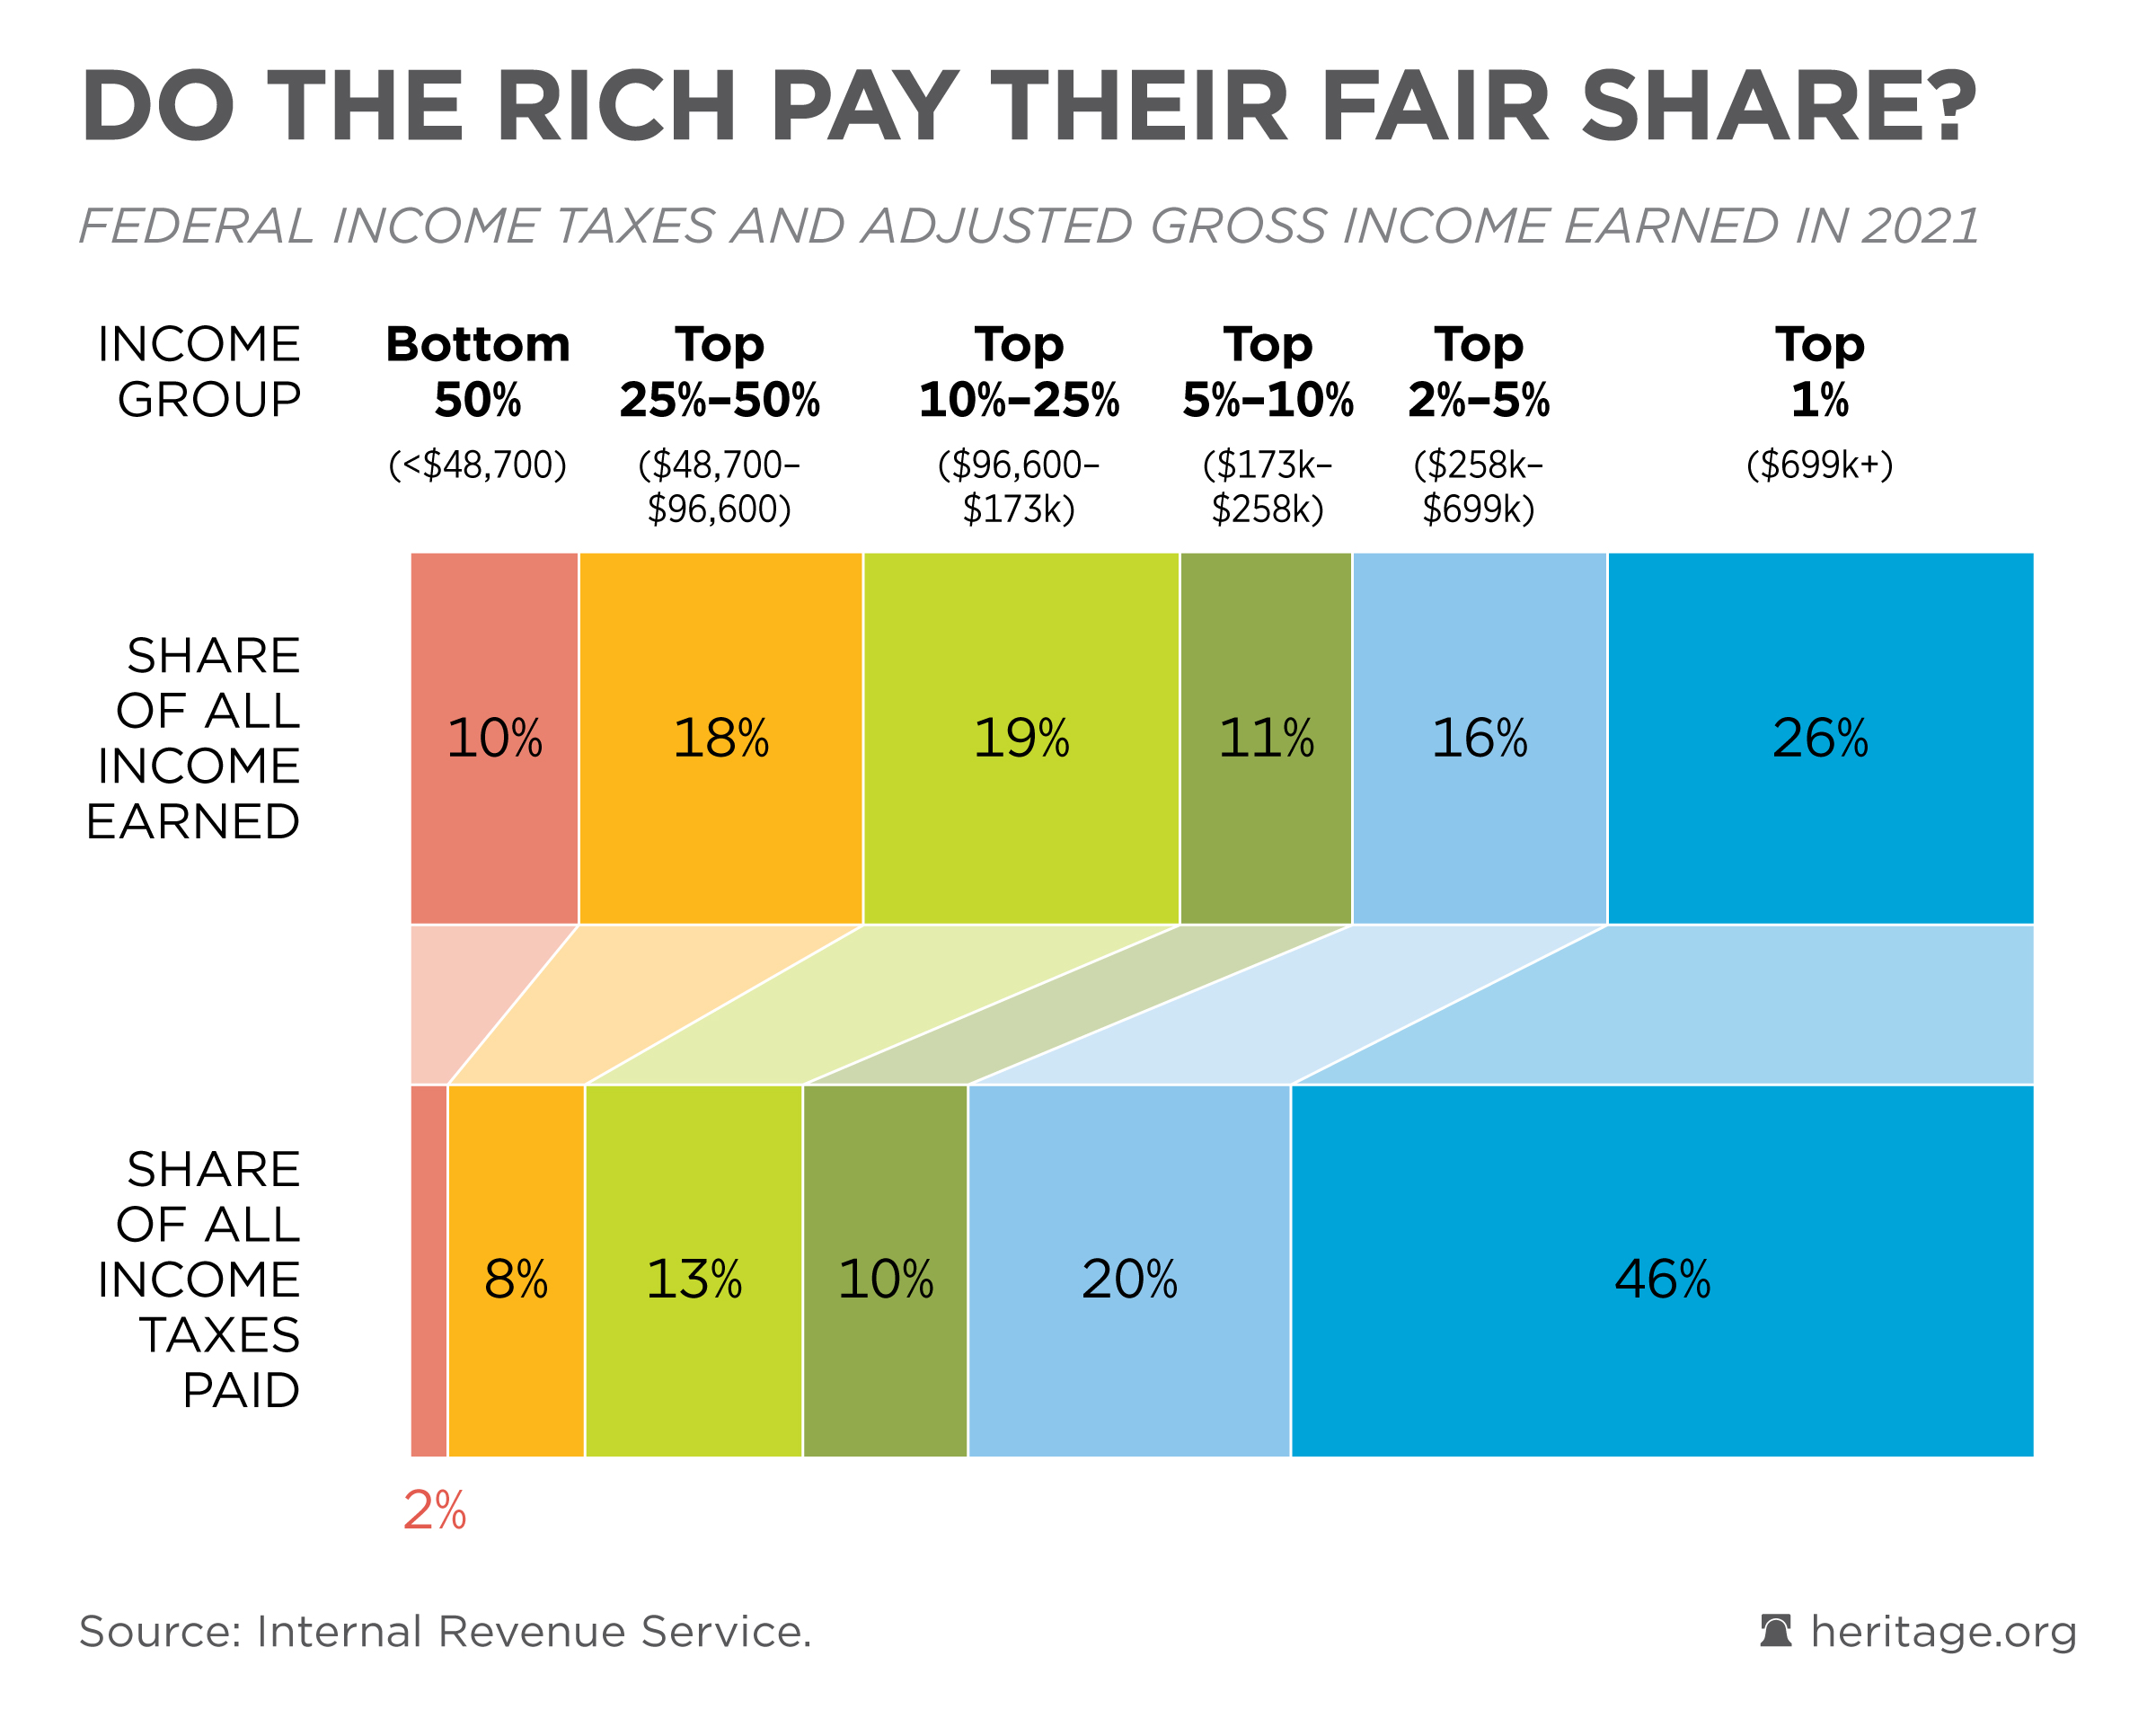
Do the Rich Pay Their Fair Share?

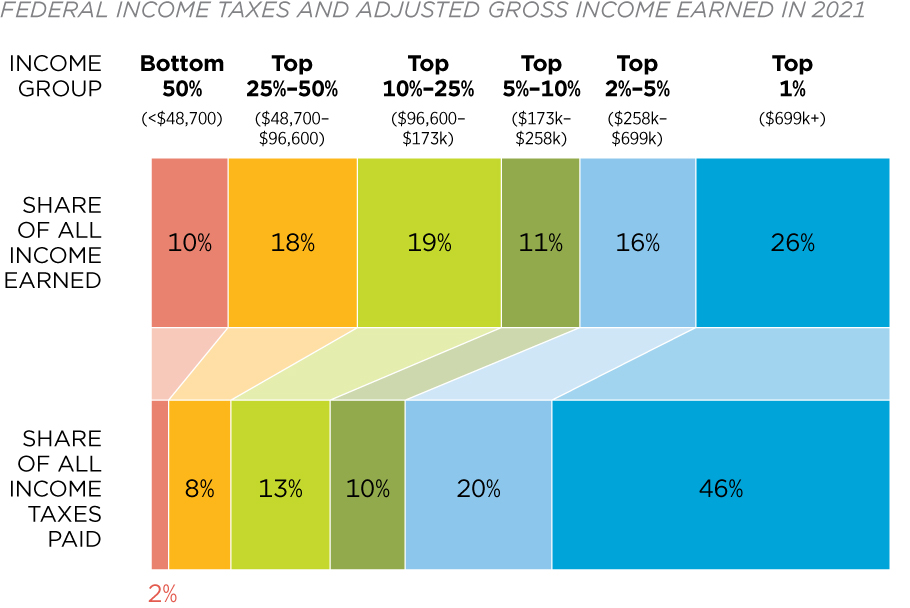
Top earners remain targets for tax increases, but the federal income tax system is already highly progressive. In 2021, the latest year with available data, the top 1 percent of income earners earned 26 percent of all income and paid 46 percent of all federal income taxes – more than the bottom 95 percent combined (33 percent).

Download
image
Download
floor chart

Updated June 27, 2024

Source: Internal Revenue Service
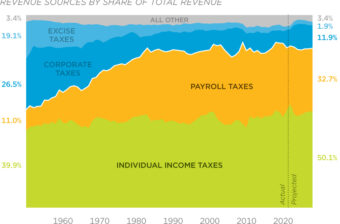
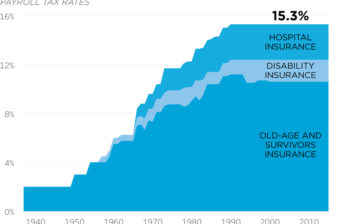
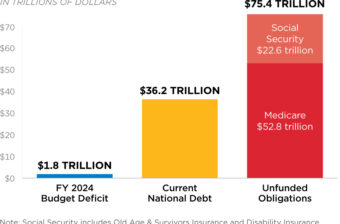
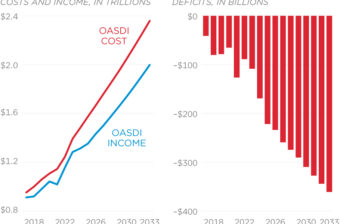
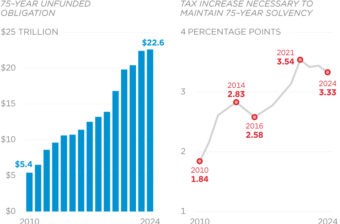
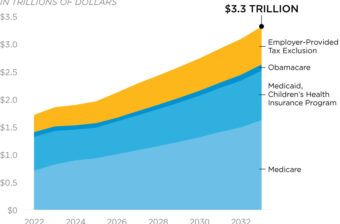
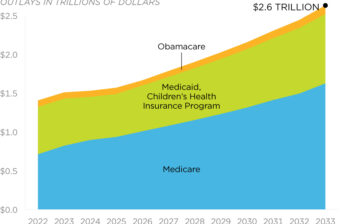
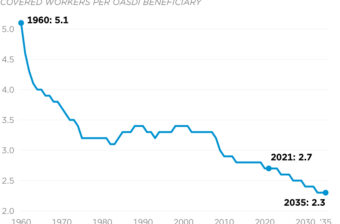
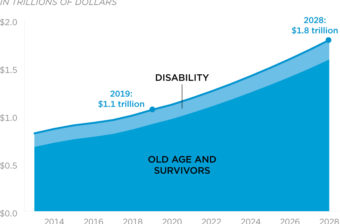
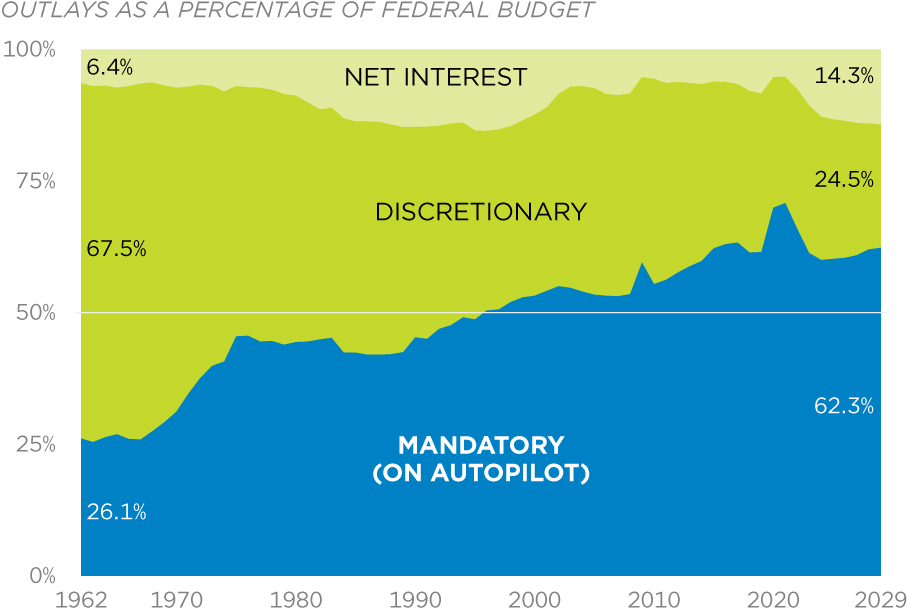
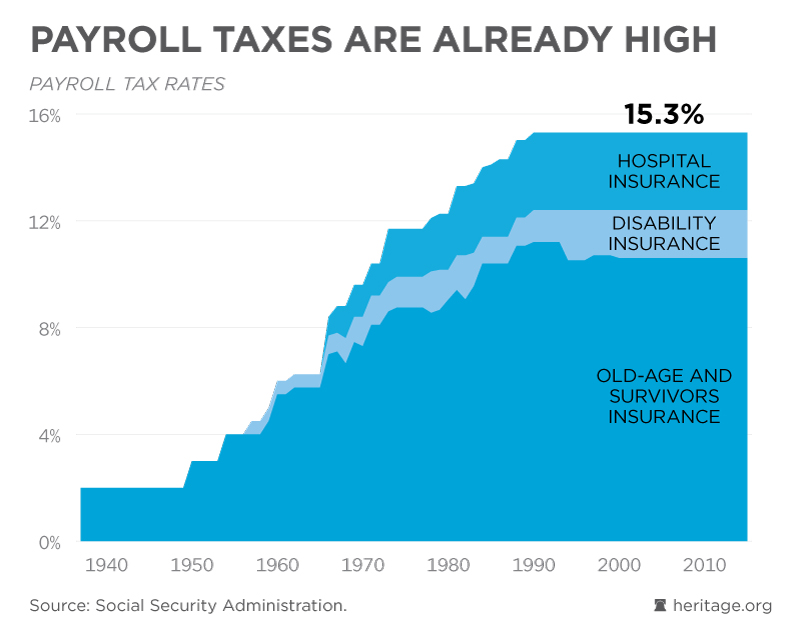
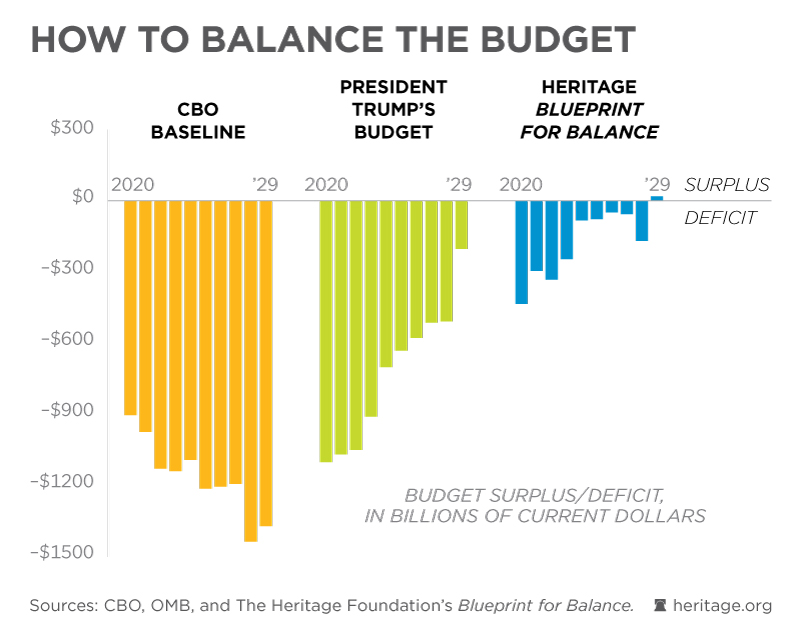
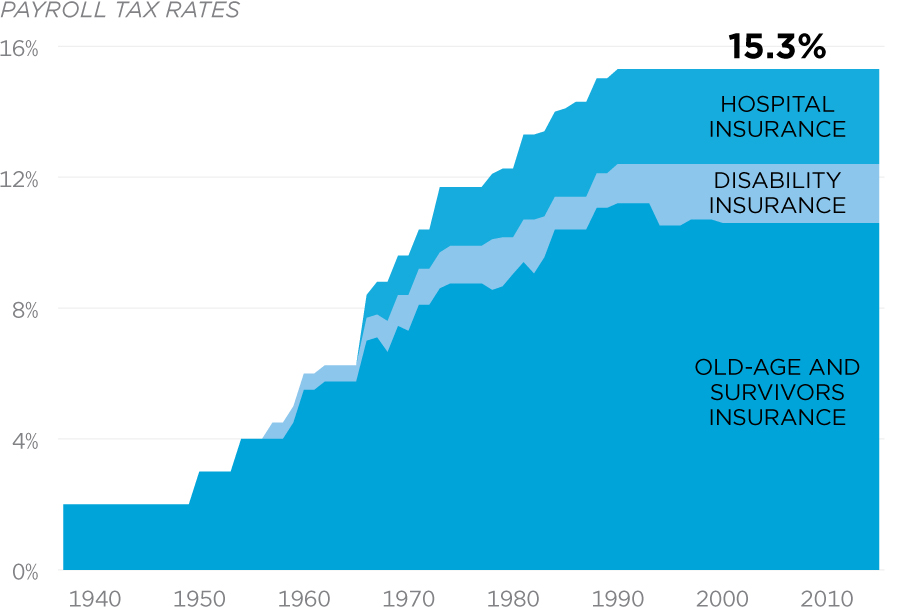
Related Charts
Related Charts

Autopilot Spending Devours Budget

Mandatory spending and interest on the debt increase on autopilot. Congress only appropriates funds for the discretionary portion of the budget on an annual basis. Autopilot spending makes up roughly three-quarters of the budget and is growing rapidly.

Download
image
Download
floor chart

Updated March 28, 2024

Source: Office of Management and Budget

Related Charts

How to Balance the Budget

Absent reform, the Congressional Budget Office projects that budget deficits will rise sharply over the coming decade. Heritage’s budget plan—Blueprint for Balance—reforms entitlements, right-sizes discretionary spending, eliminates deficits, and reduces taxes.

Additional Sources: Office of Management and Budget The Heritage Foundation’s Calculations

Download
image
Download
floor chart
Related Charts

Public Debt for Every American

Out-of-control spending in Washington is burdening each American with large and growing levels of public debt. A child born in 2023 will have a $82,590 share of publicly held federal debt upon becoming an adult.

Additional Sources: U.S. Census Bureau

Download
image
Download
floor chart

Updated March 28, 2024

Source: Congressional Budget Office

Related Charts